
Contest Results
The 24th Annual Graph Drawing Contest was held in conjunction with the 25th International Symposium on Graph Drawing and network Visualization (GD 2017).
The contest had two parts: the Creative Topics and the Live Challenge.
The creative topics were provided approximately one year before the conference and focused on free-form visualization of specific graphs. Two graphs were provided, and participants were invited to submit any drawings of one or both of the graphs. The submissions were judged by the contest committee during the symposium. This year's topics were citations among previously presented papers in the Graph Drawing Symposium, and a hypergraph depicting human metabolism.
The live challenge was held during the conference in a format similar to a typical programming contest, where teams were presented with a collection of challenge graphs and had one hour to submit their highest scoring drawings. This year's topic was to maximize the smallest crossing angle in a straight-line drawing of a graph with vertex locations restricted to a grid. For details, see here.
Creative Topics: Graph Drawing Citations
We received two very nice submissions for this category.
Da Ye (University of Sydney)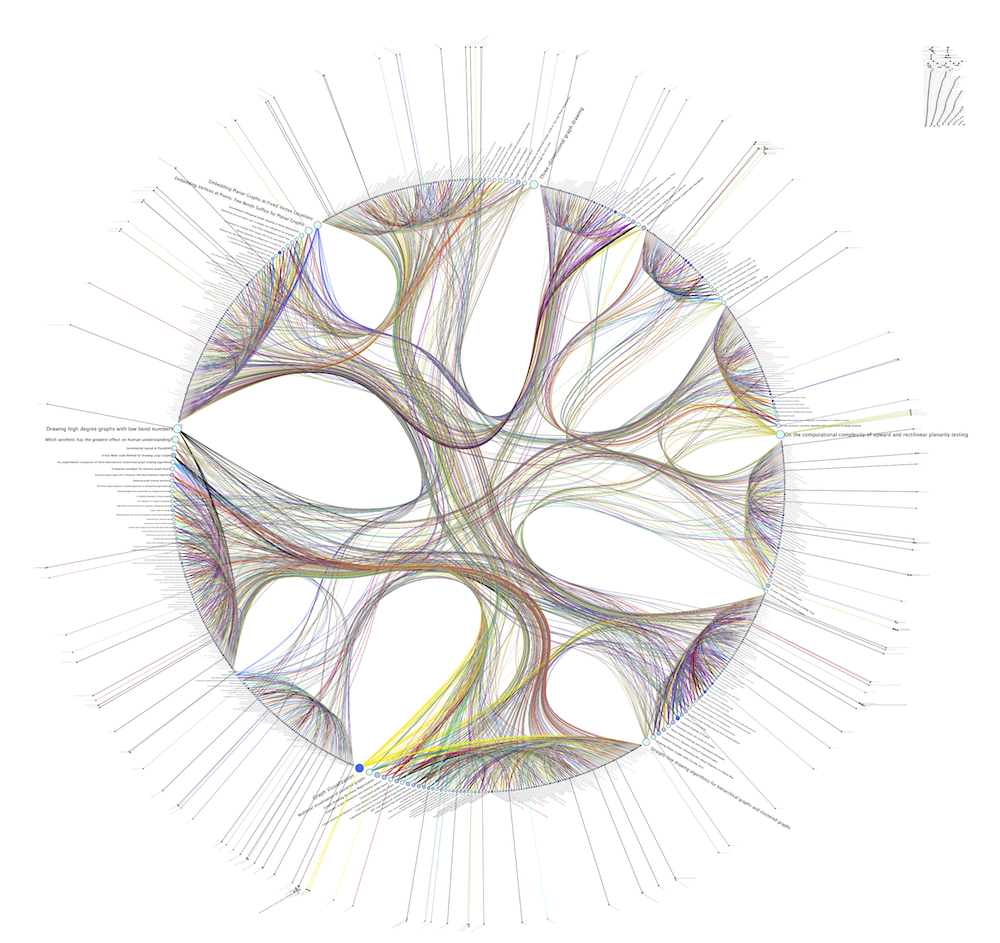
The committee likes the combination of clustering with radial layouts and organic edges, and a circular layout for the clusters that are connected with bundled edges. The visualization gives a good global overview of the graph structure, showing high-level connections between different topics in the community.
Finally, we announce the winner of the 2017 Graph Drawing Contest, Creative Topics: Graph Drawing Citations:
Steven Wang (University of Sydney)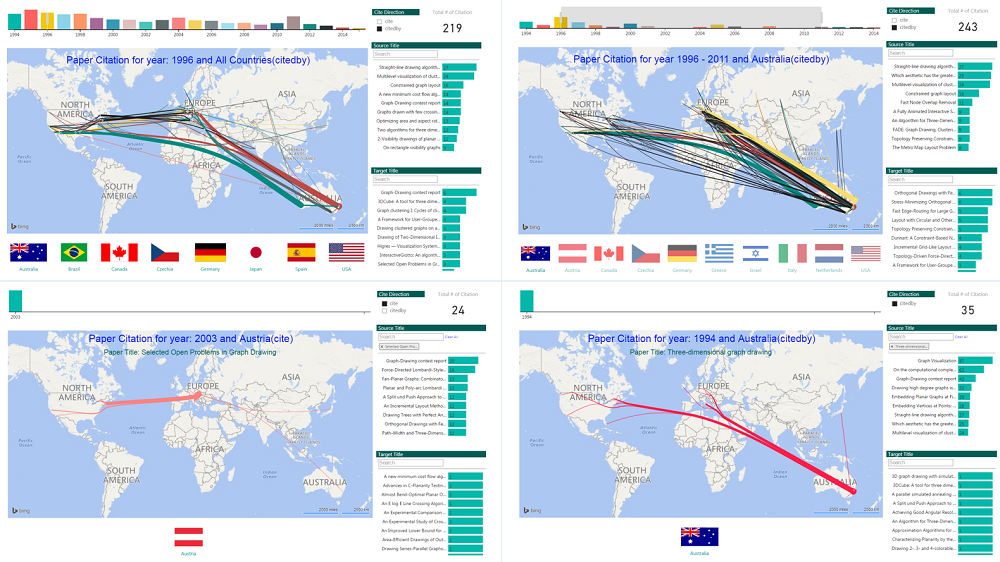
The committee likes the geolocated vertex placement in this subbmission, which gives a good picture of the local and global collaborations in the community. The interactive visualization allows the user to focus only on citations from certain papers, countries, or years, making it possible to explore the global graph structure as well as zoom in on specific details.
The graph can be explored here.
Steven Wang: The location-based citation network can easily identify where the papers were cited by (or citing based on the cite direction selection). The directed flow from source to target paper is converged at the target, the thickness of the edge indicates how many times the source paper was cited by. The context menu in the interactive view displays more detailed information like authors who contributed to the paper.
Creative Topics: Human Metabolism
We received only one nice submissions for this category. We announce the winner of the 2017 Graph Drawing Contest, Creative Topics: Human Metabolism:
Dabian Klute and Irene Parada (TU Wien and TU Graz)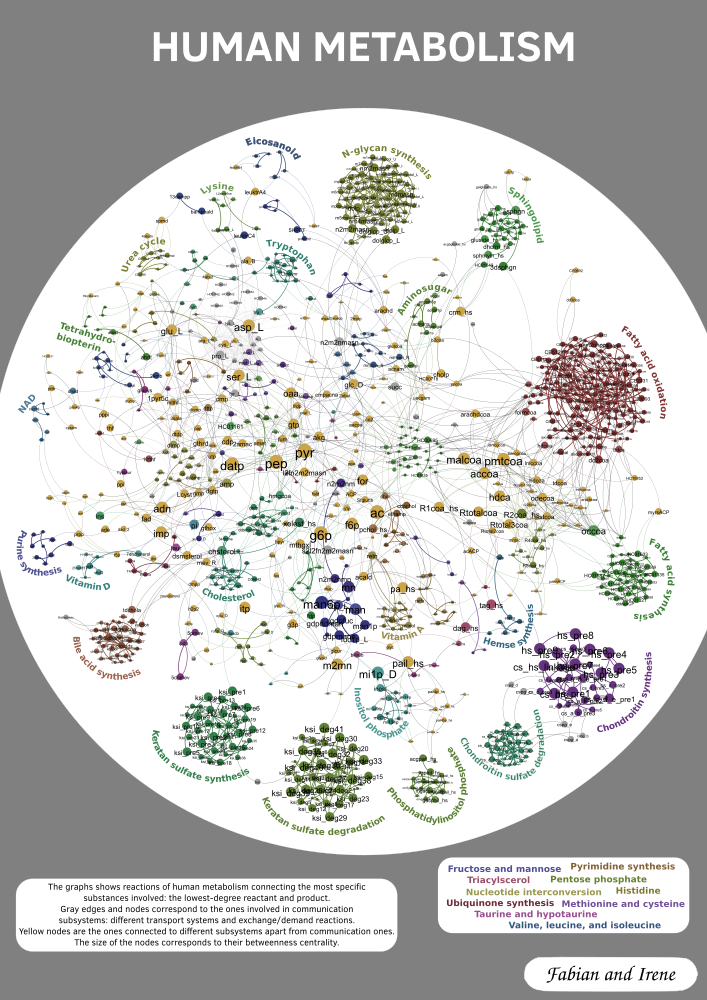
The committee likes the organic look of the submission; the use of curved and mostly short edges makes it possible to follow individual connections even in the somewhat chaotic center of the drawings. The committee also likes the way in which the visualization managed to cluster and label distinct sections of the graph. The labels of individual nodes are somewhat hard to read, but the use of colour partially alliviates that problem. The committee believes that the approach taken by the authors could serve as a starting point for an alternative visualization of Recon 2 that could be used more effectively by domain experts.
Fabian Klute: In order to filter the information, we thin out the graph in a preprocessing step. For every reaction we keep only the lowest-degree reactant and product. Isolated and degree one nodes are removed and only the biggest component is kept. Additionally we identify nodes corresponding to different biological compartments (e.g. co2[c], co2[e] are contracted into one co2 node). To generate the layout we add edges to keep the subsystems closer together. The size of the nodes depends on its betweenes in the reduced graph. Then the layout is calculated using the Fruchterman-Reingold algorithm. Finally we color the nodes based on subsystems. We distinguish two big groups of subsystems, the communication or transportation ones and the proper ones. As the name suggests the first kind mainly connects the proper subsystems. Based on this we categorize nodes into five cases, depending on if they are inside a proper subsystem, on its boundary, in a transport system, on the boundary between two different transport systems, or between two proper subsystems.
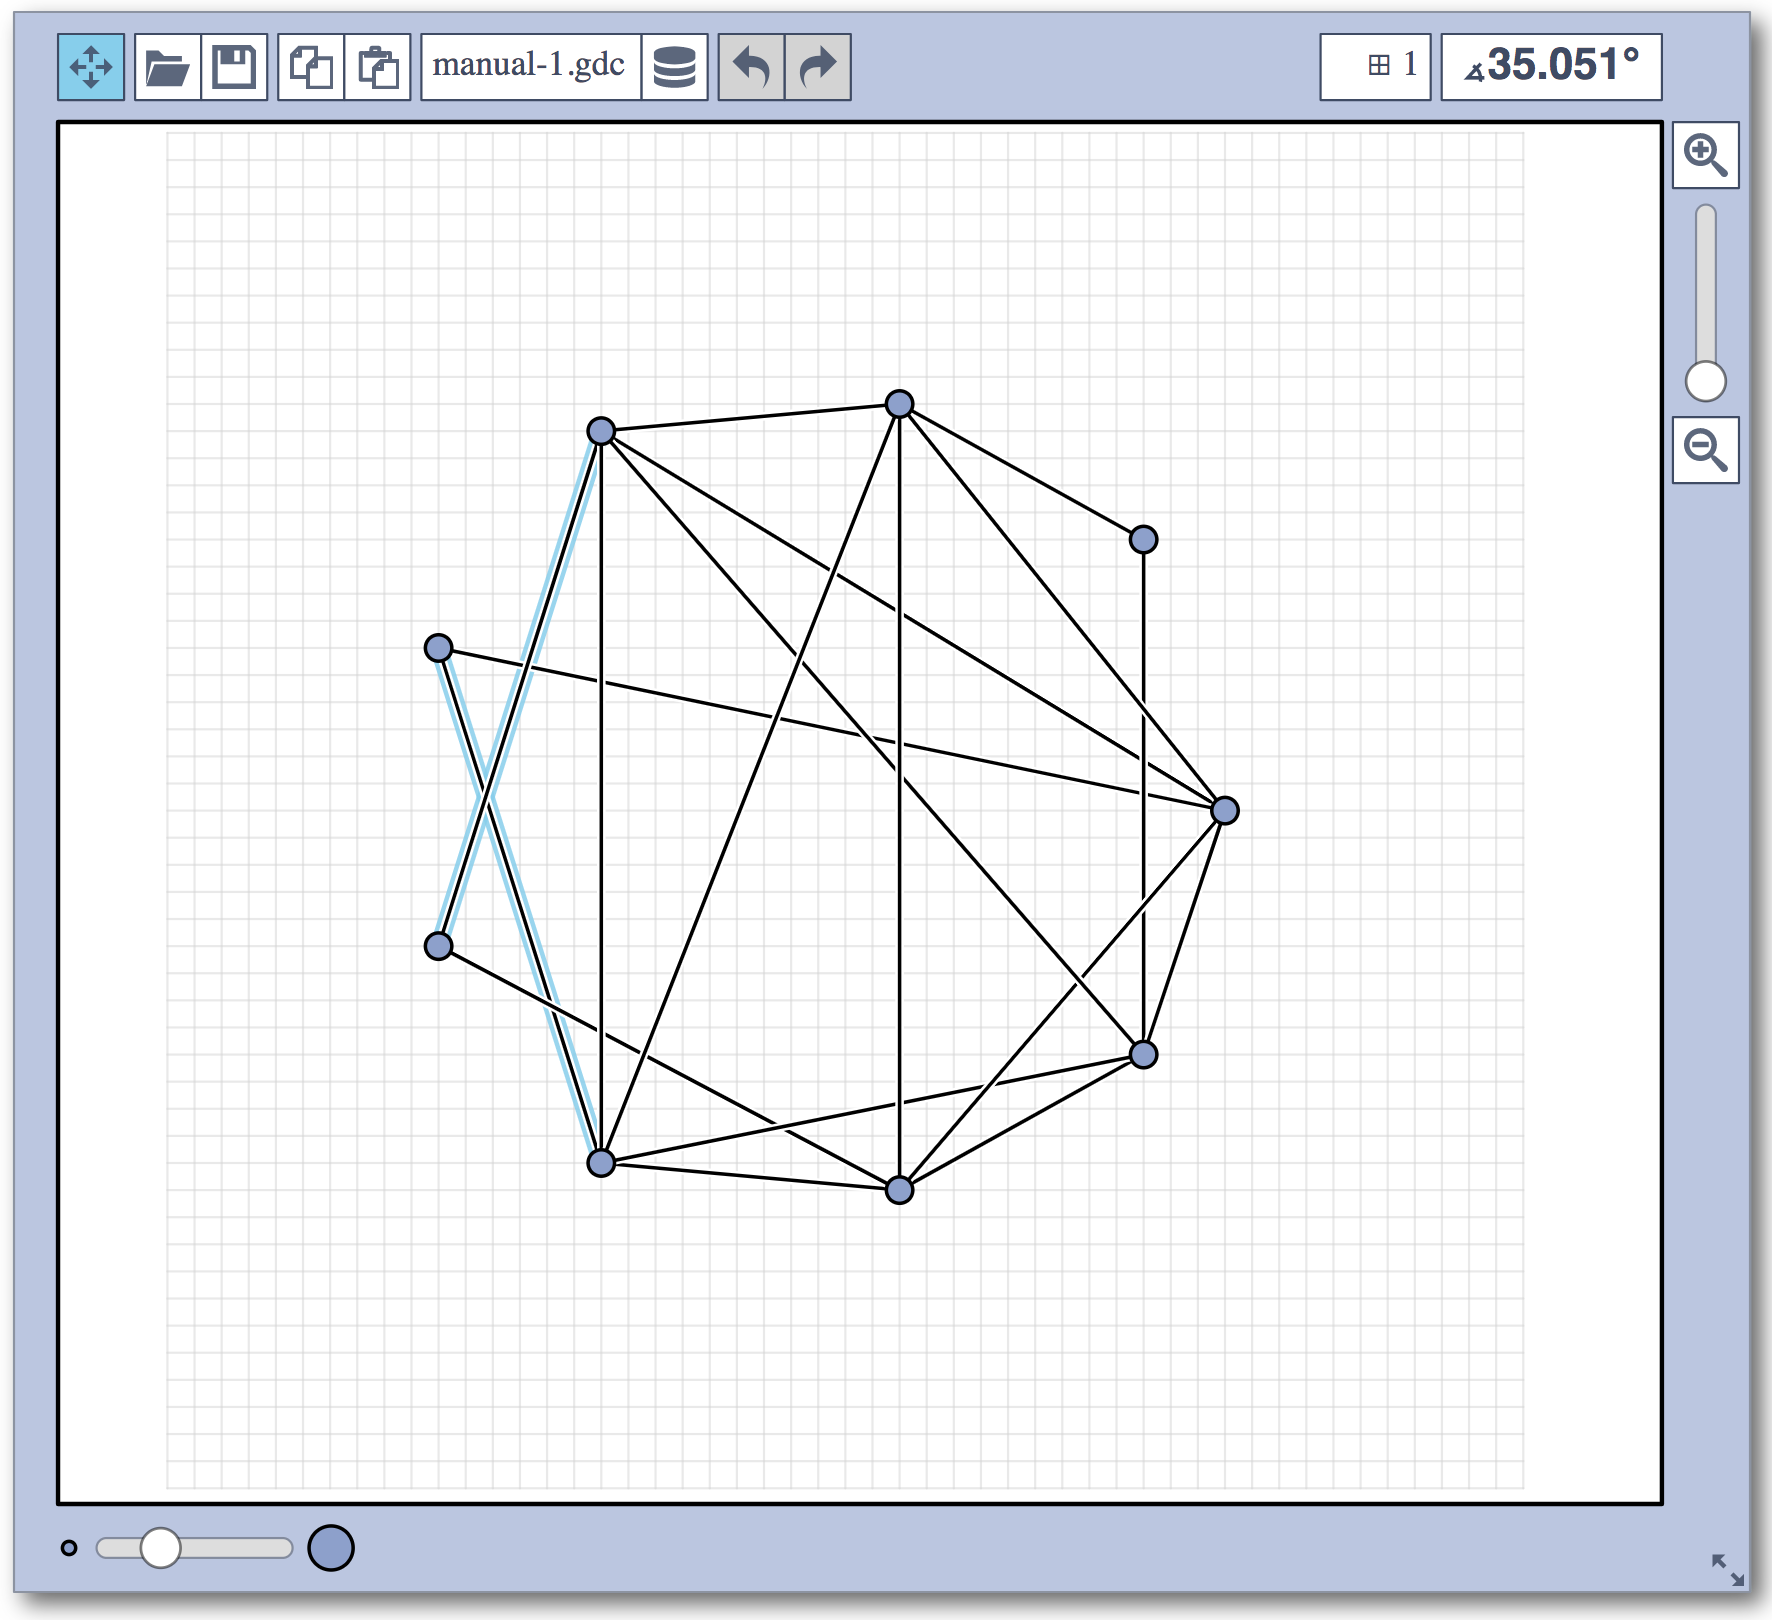
Live Challenge: Manual Category
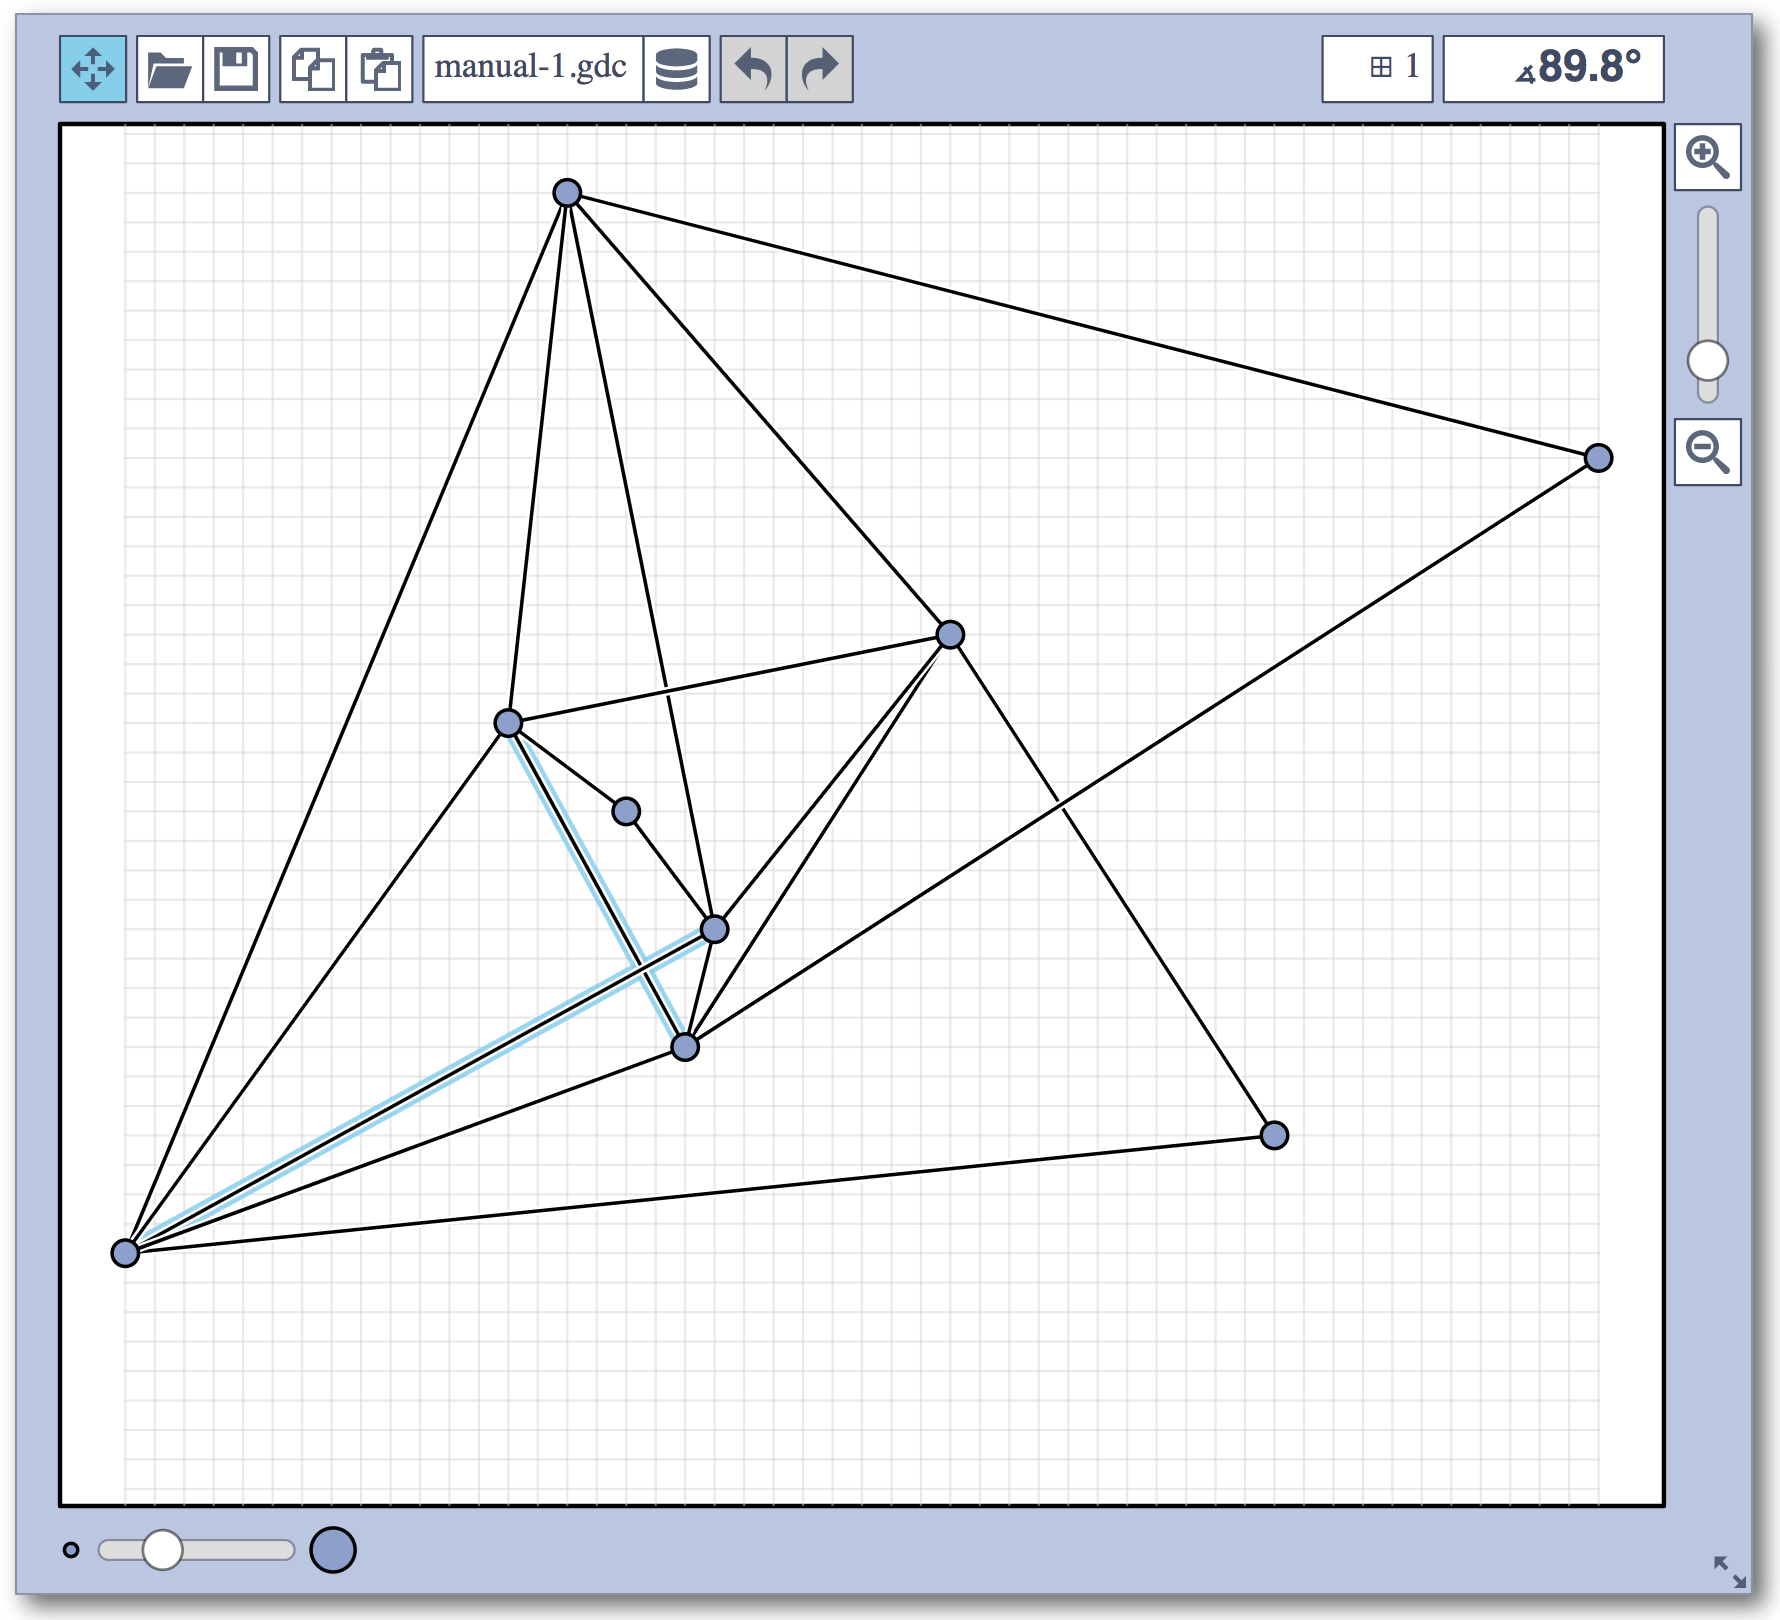
In the manual category, participants were presented with seven graphs. We present the input layouts and the best manual submitted solutions (click on the images to download the gdc files).
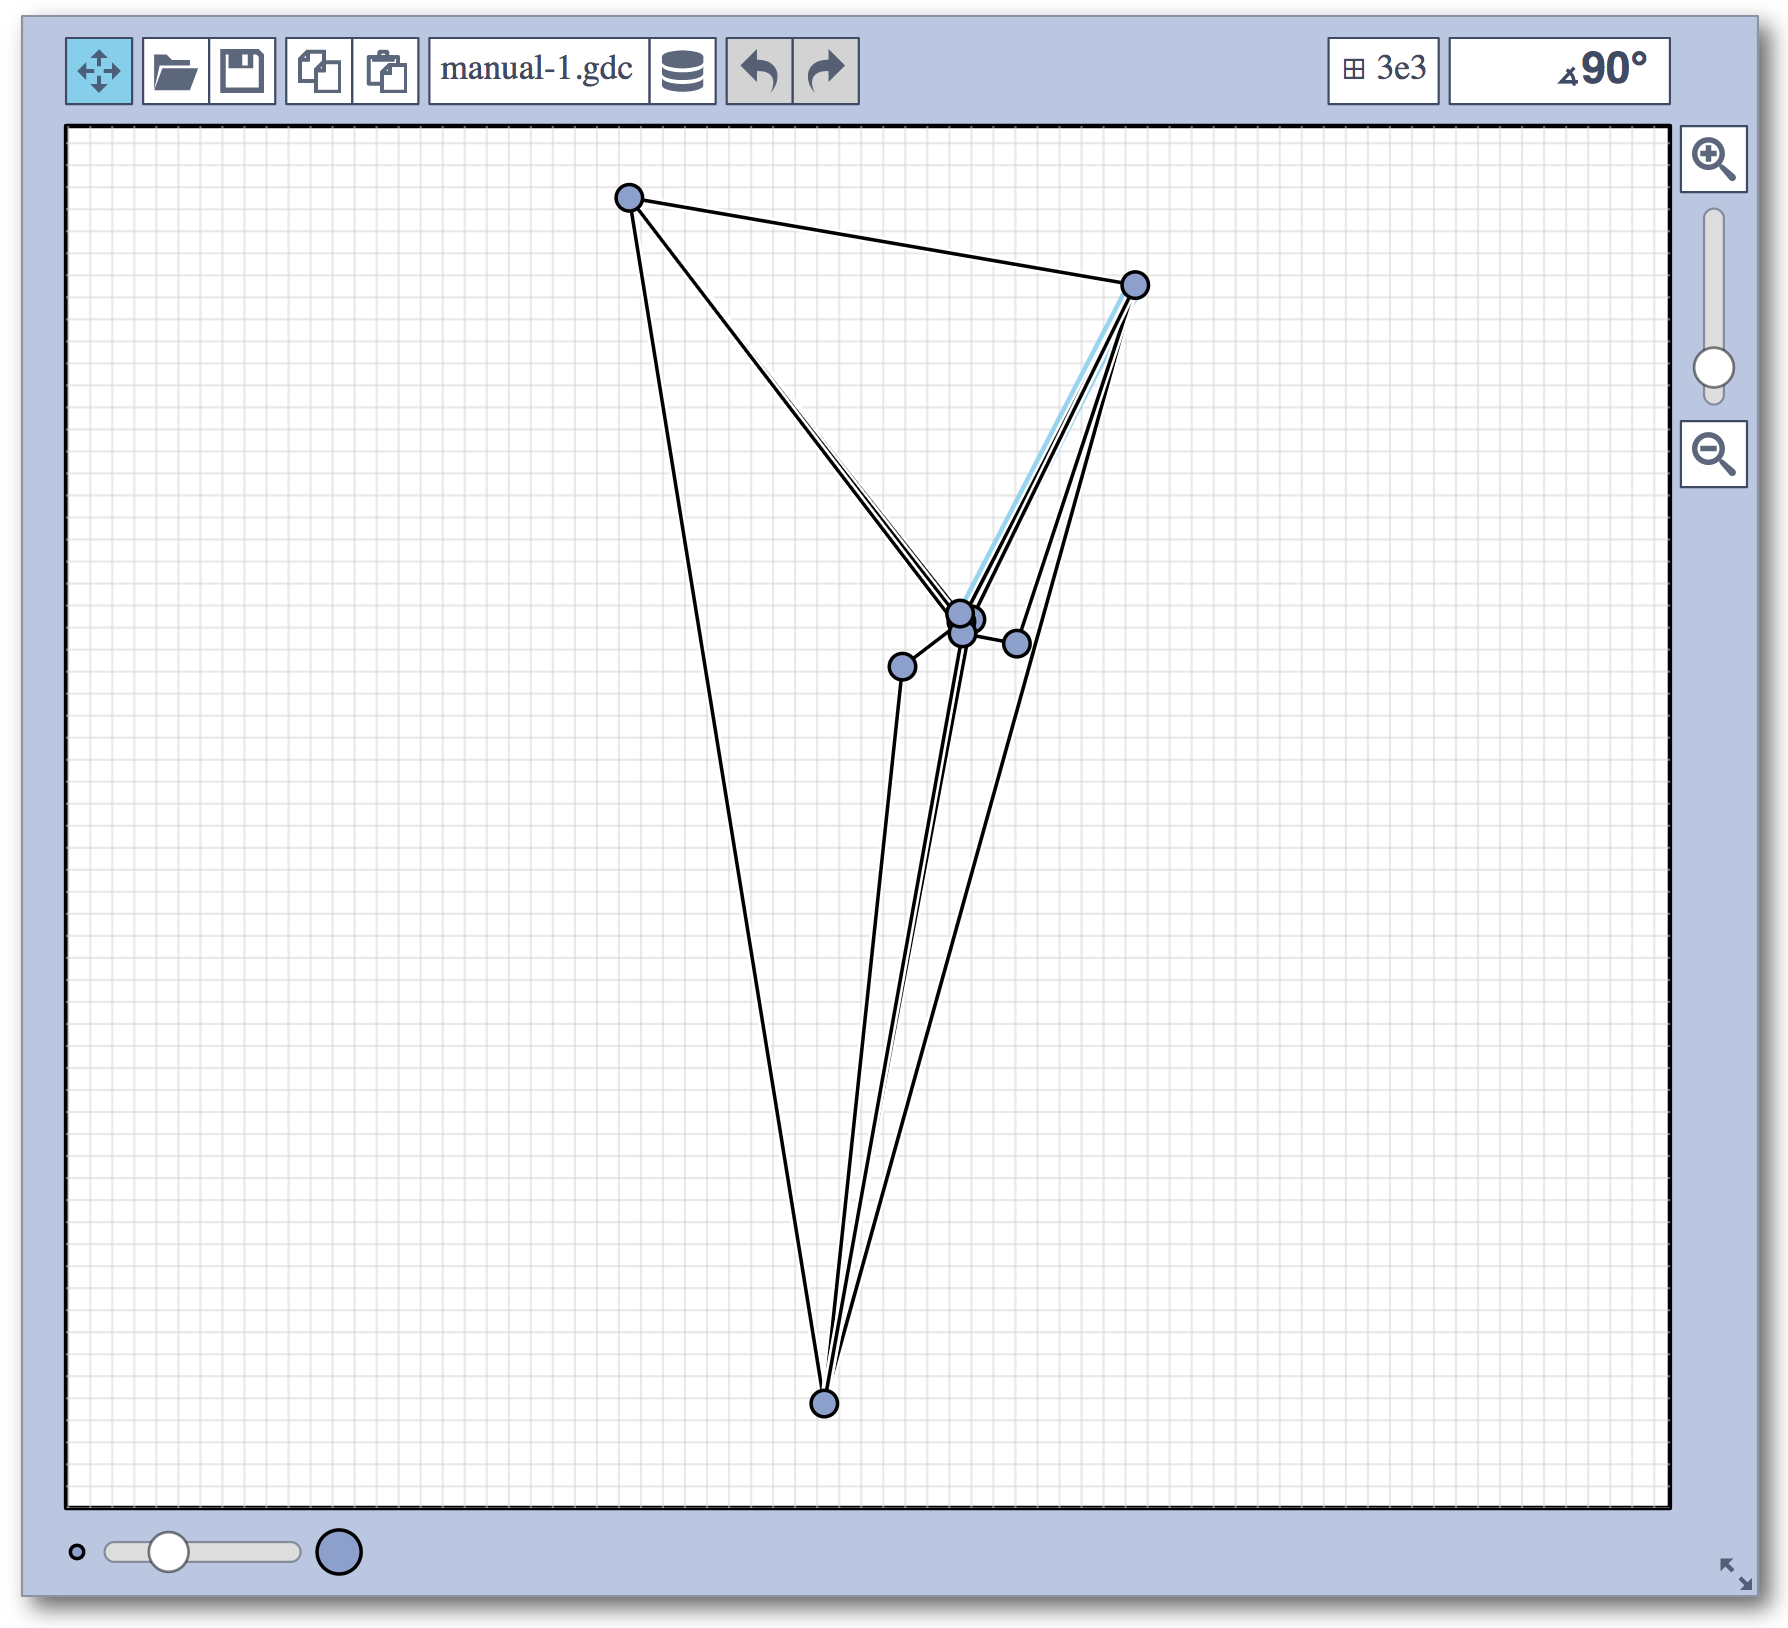
problem 1: input
|
problem 1: best manual submission
|
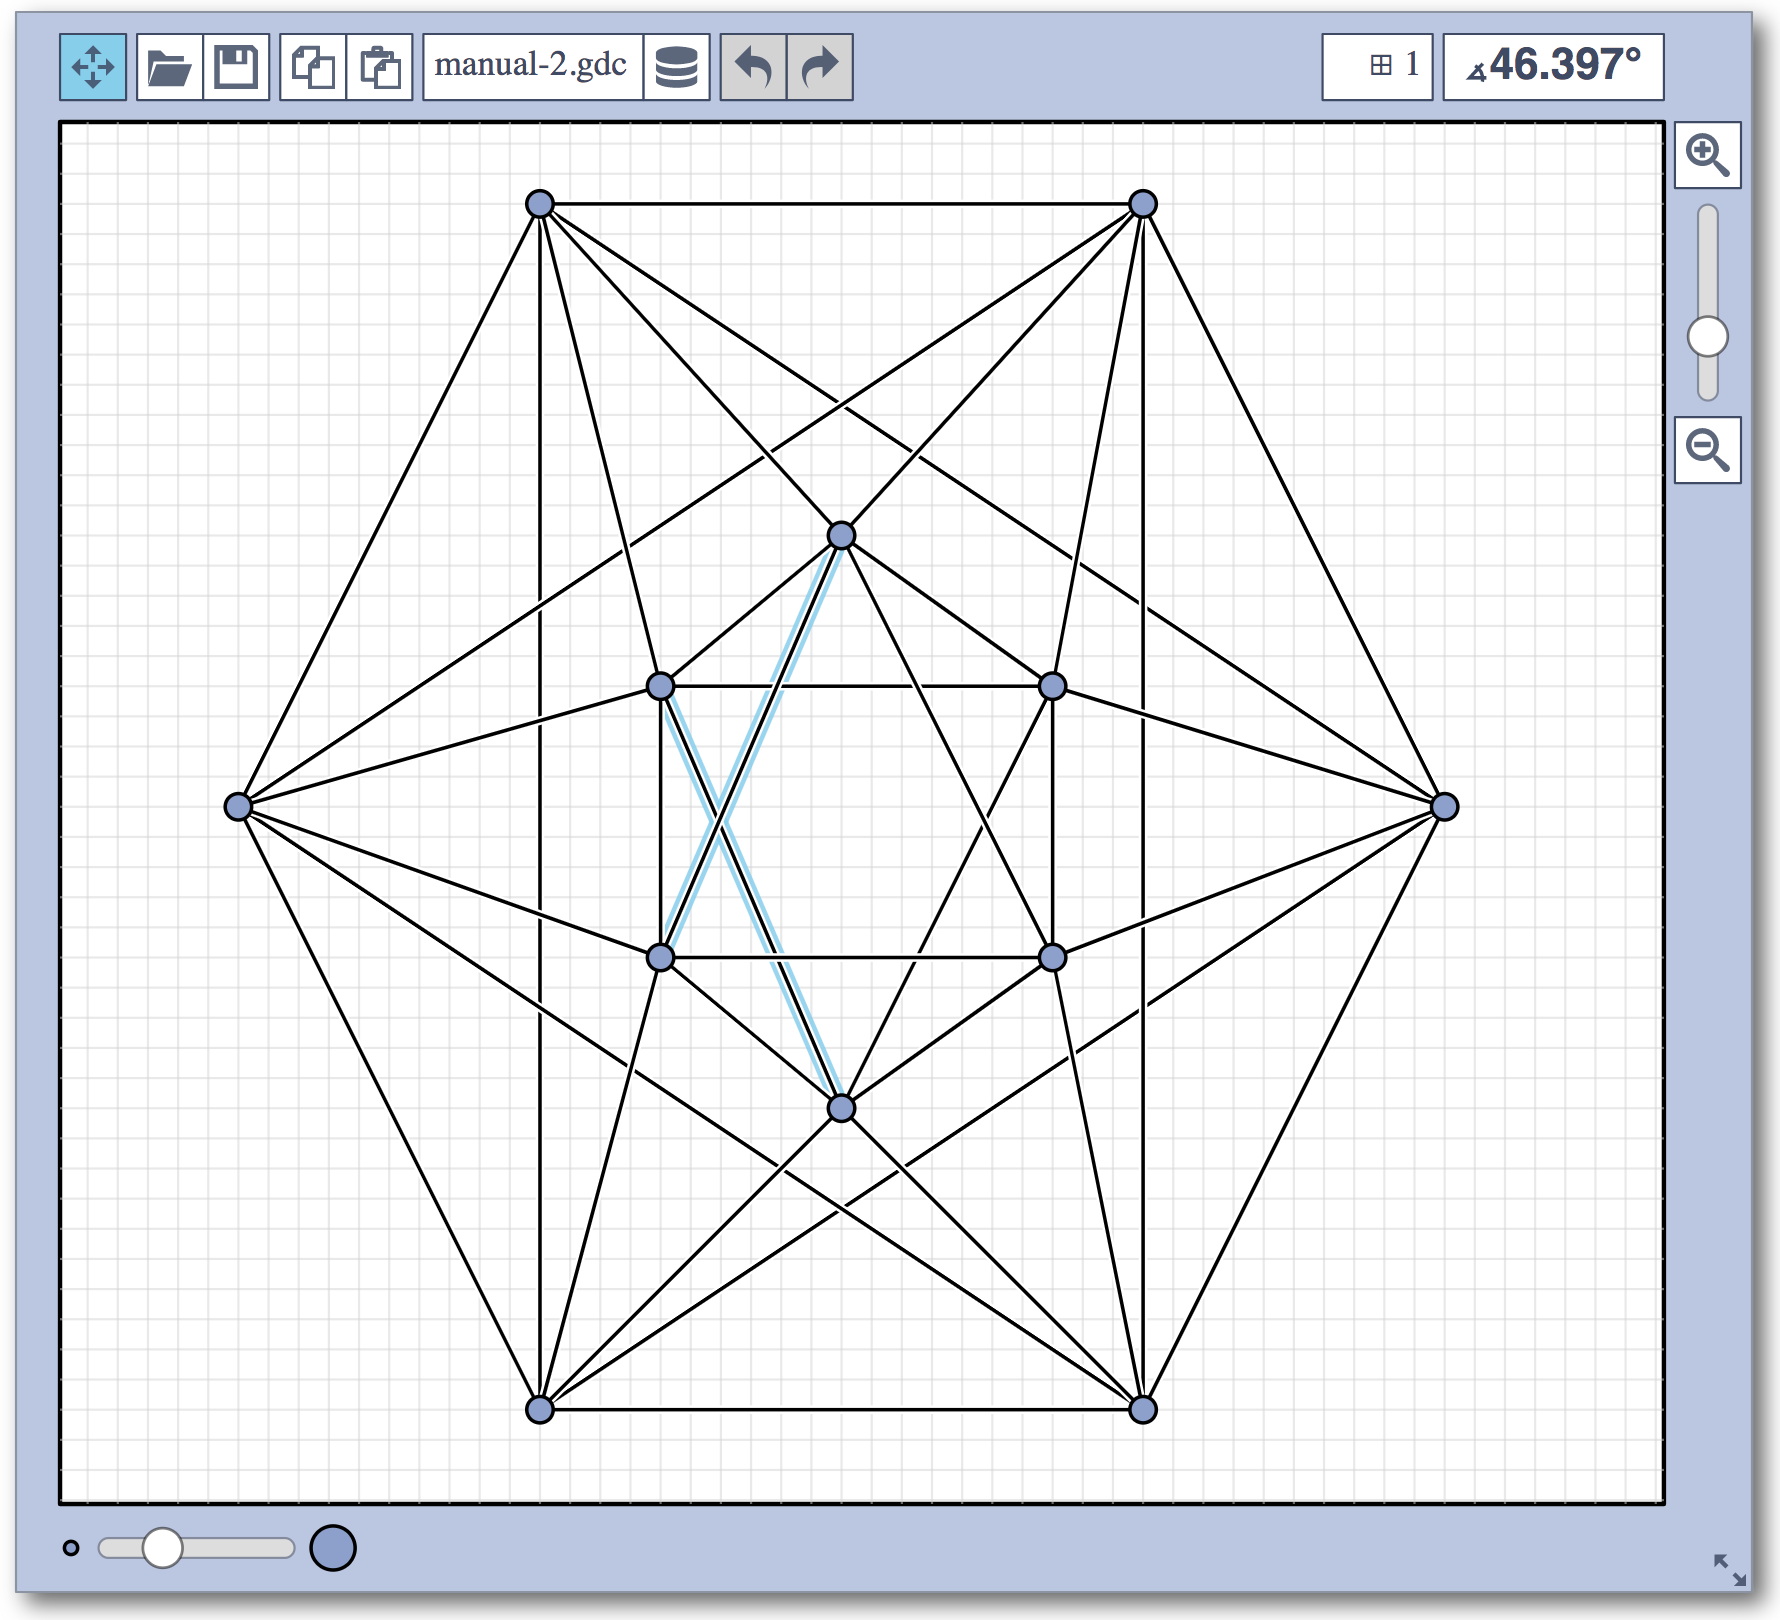
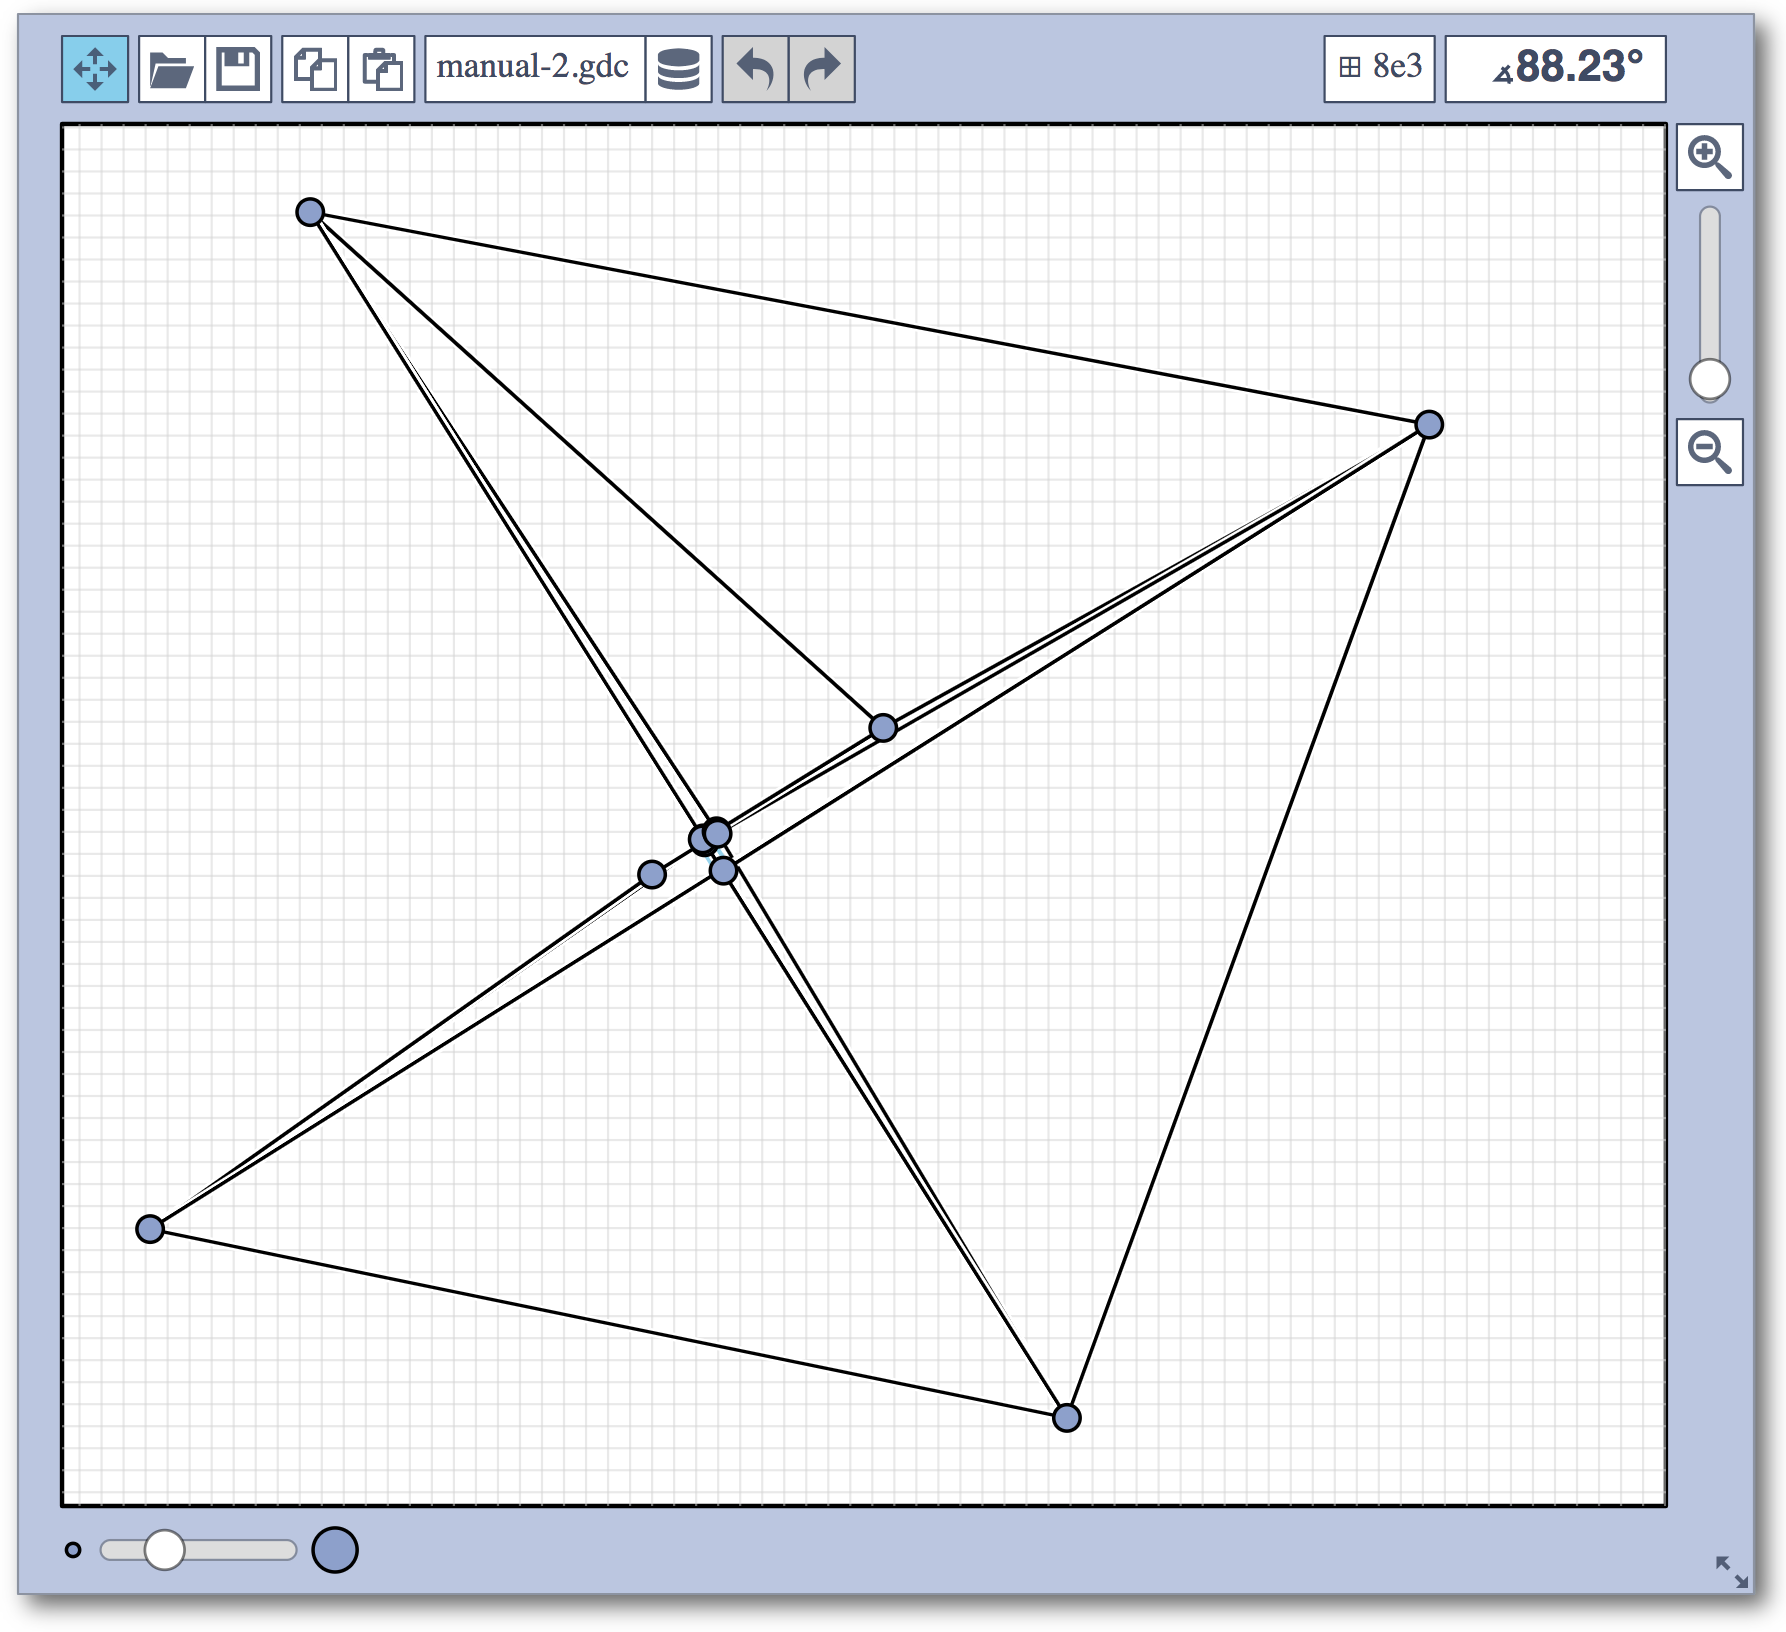
problem 2: input
|
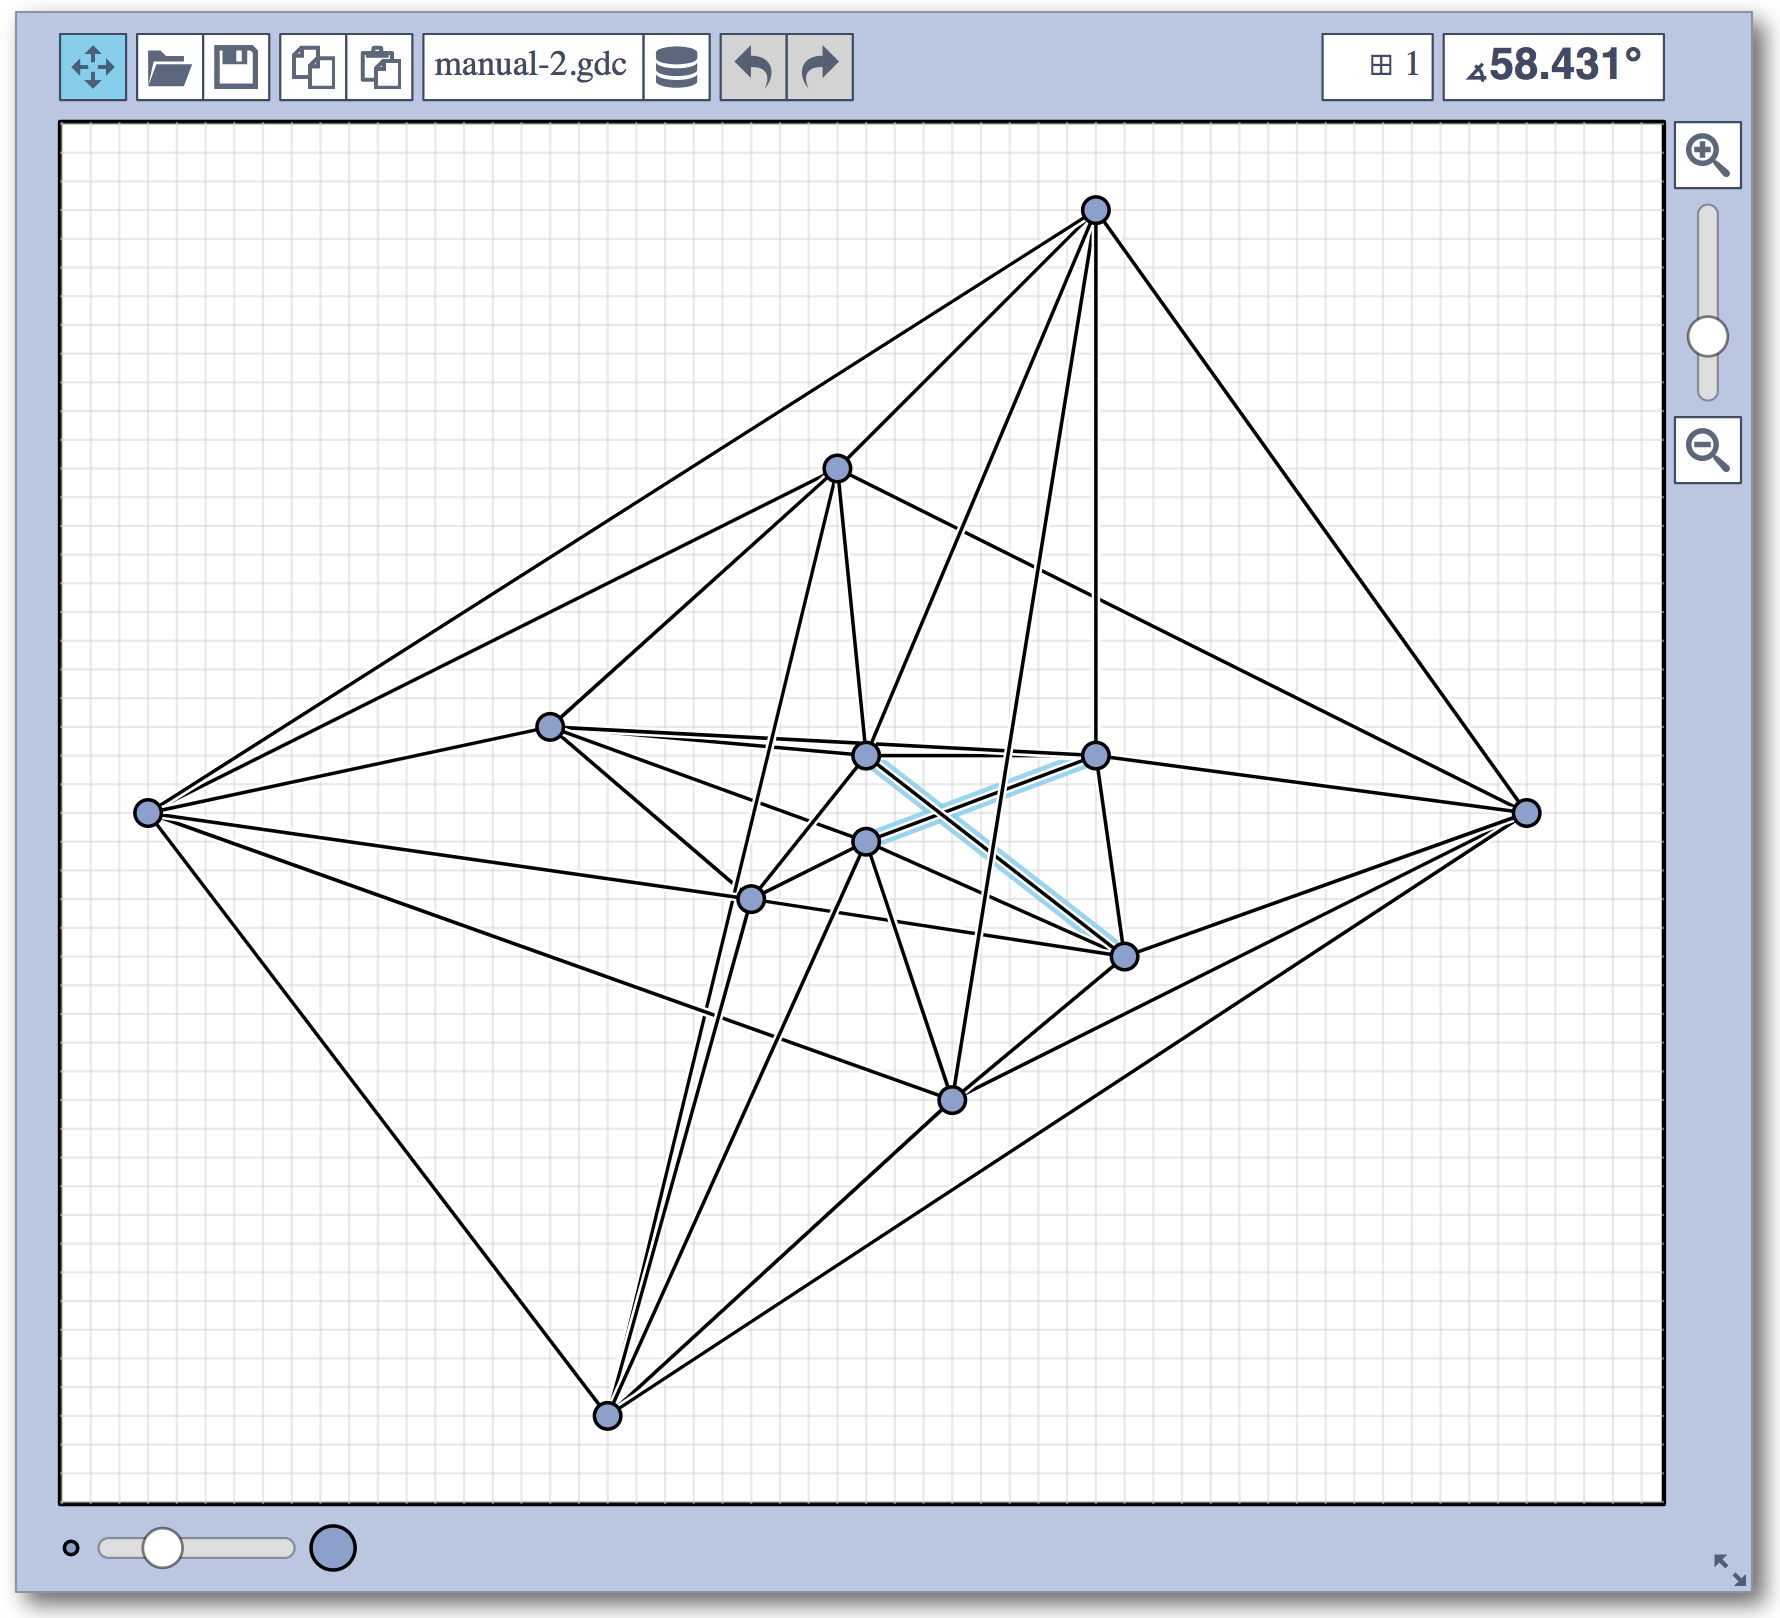
problem 2: best manual submission
|
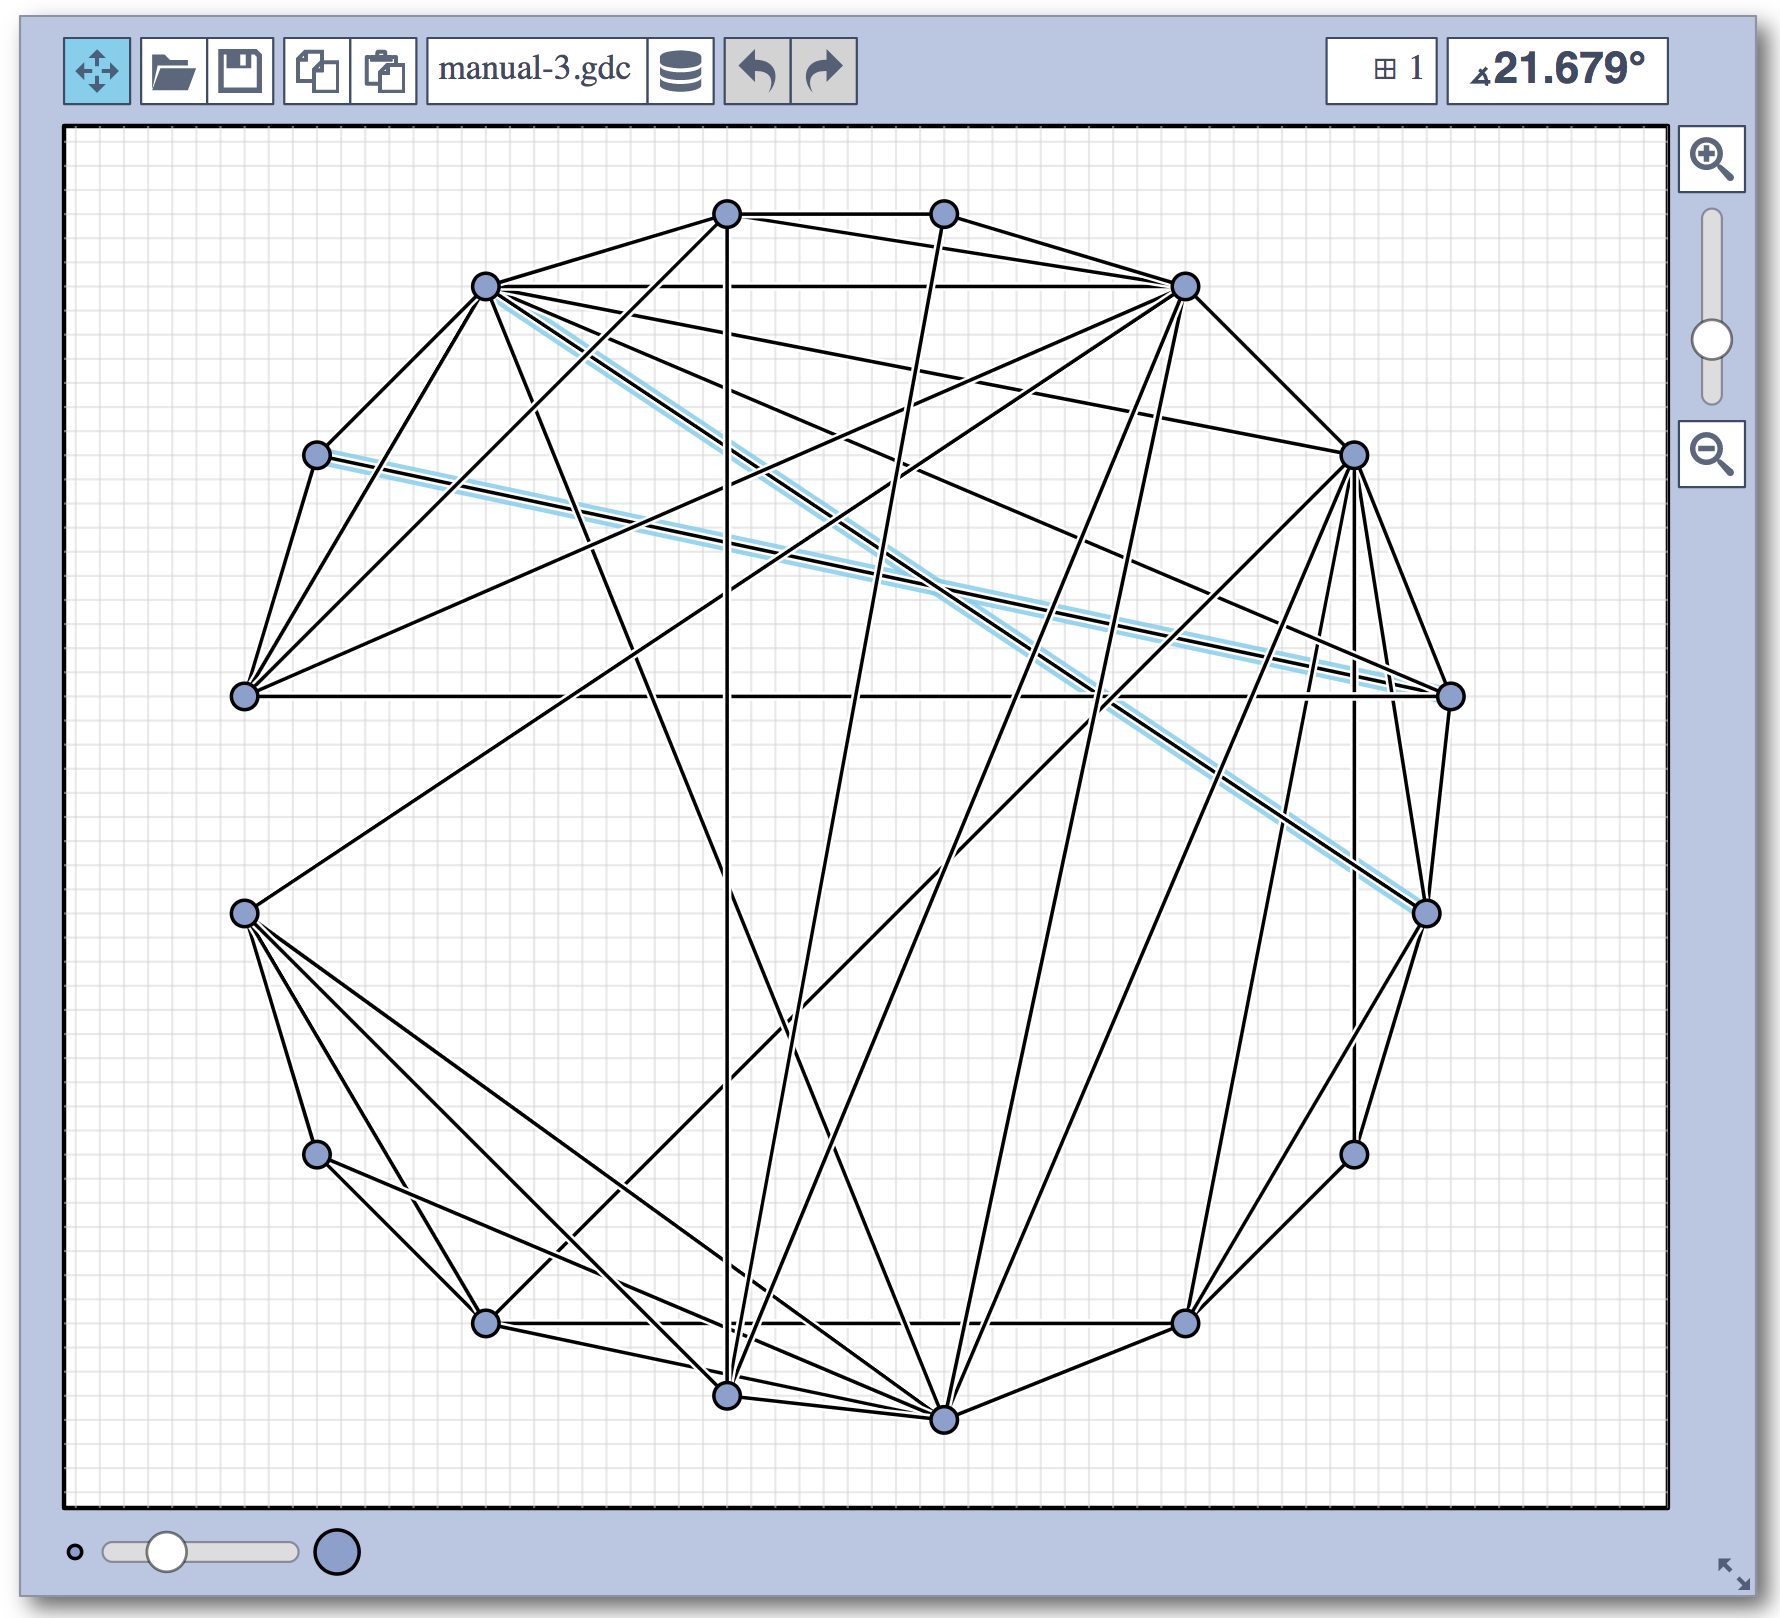
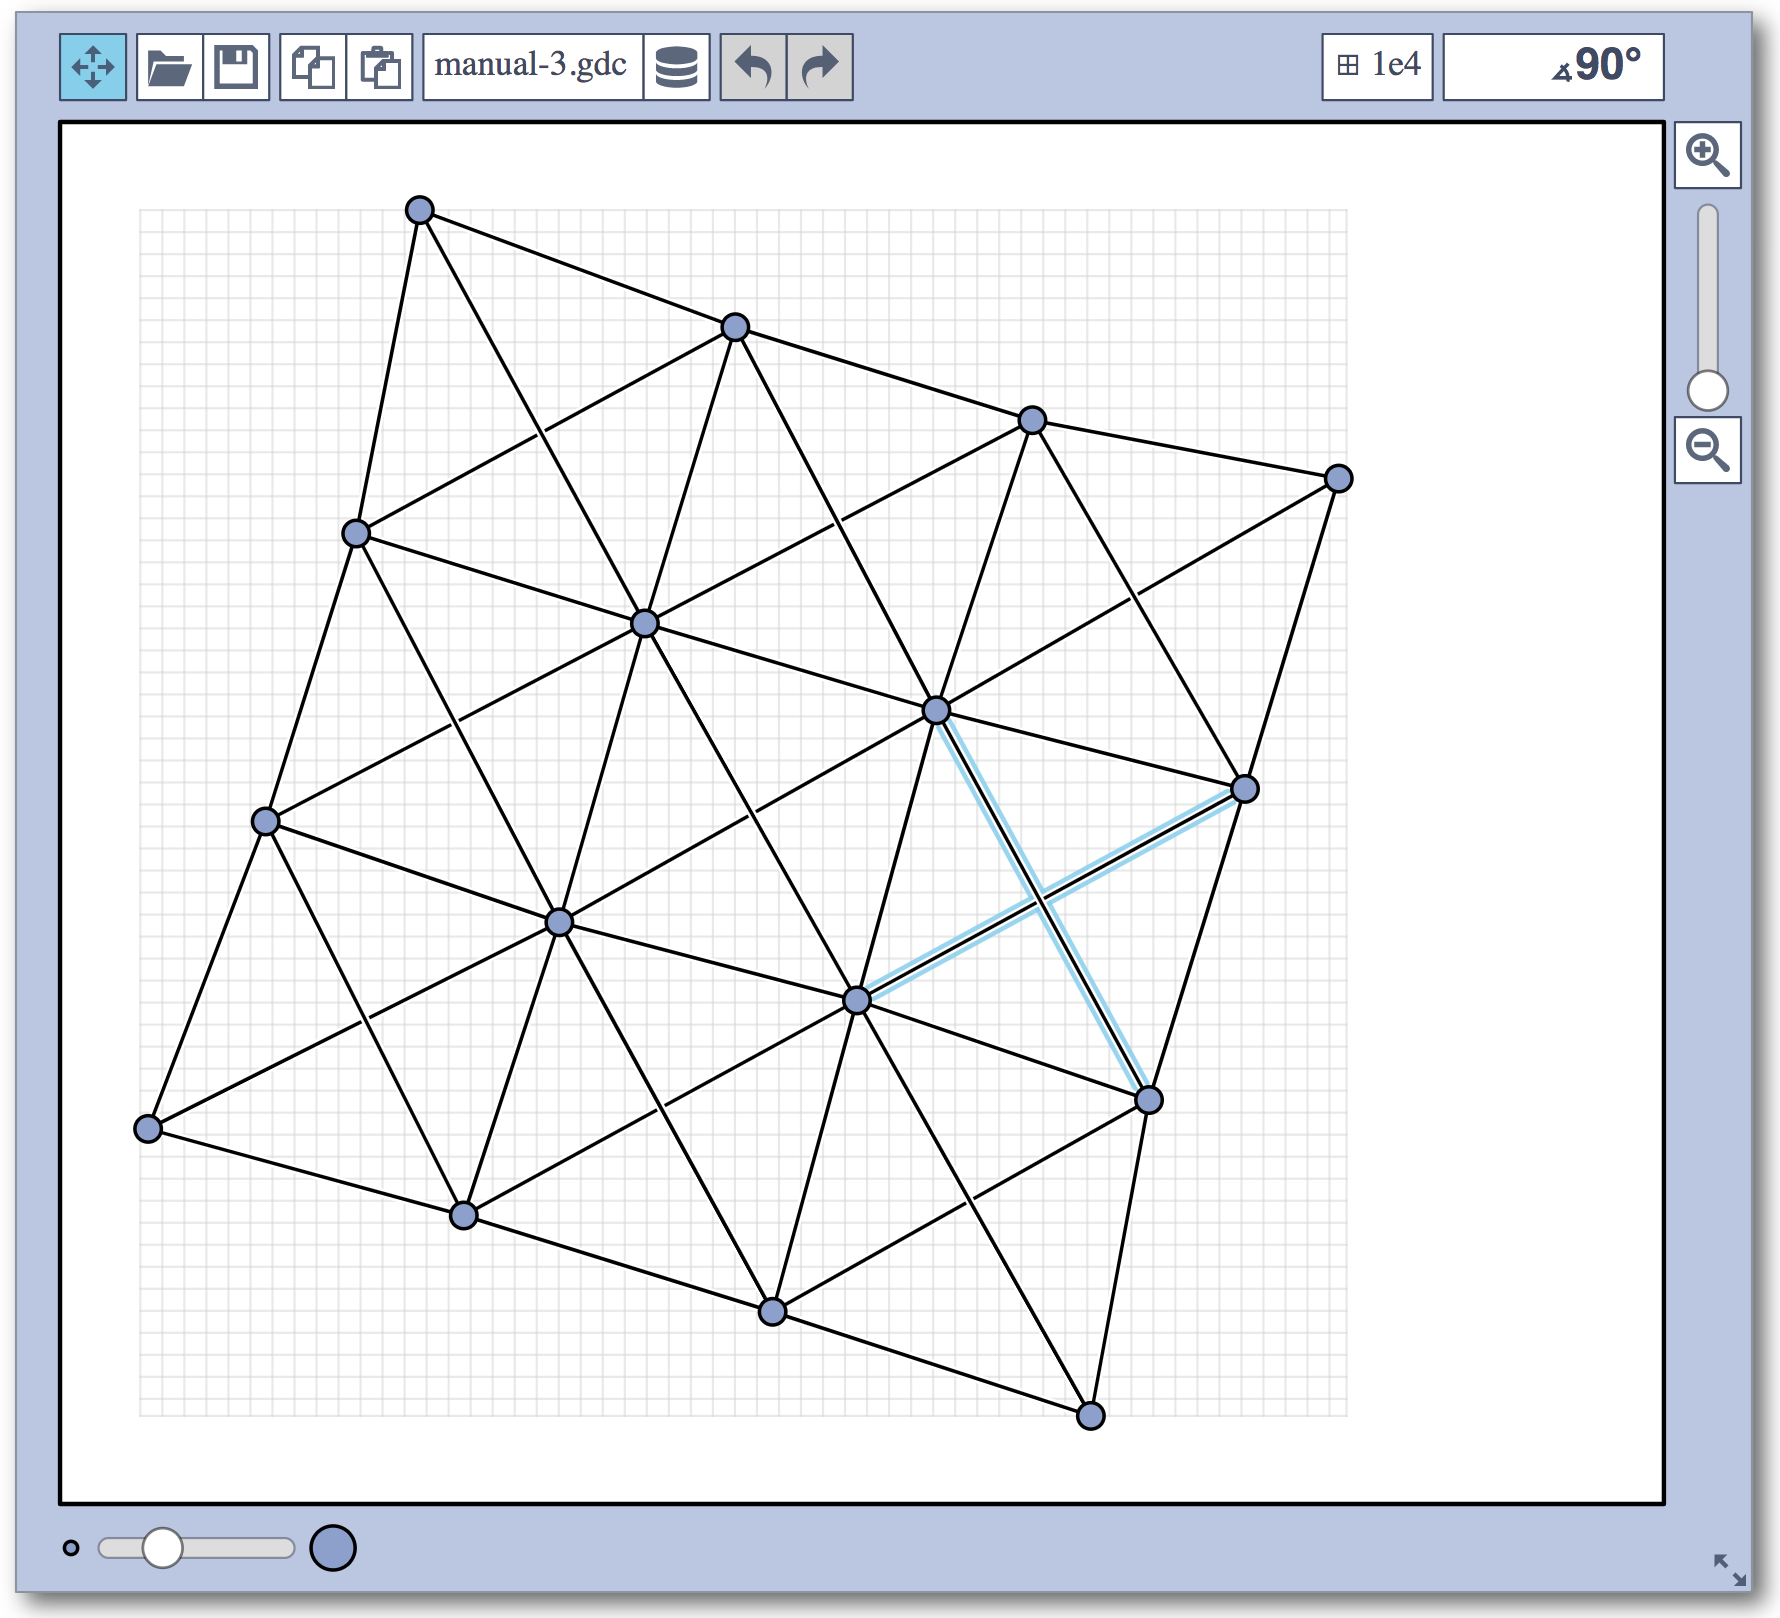
problem 3: input
|
problem 3: best manual submission
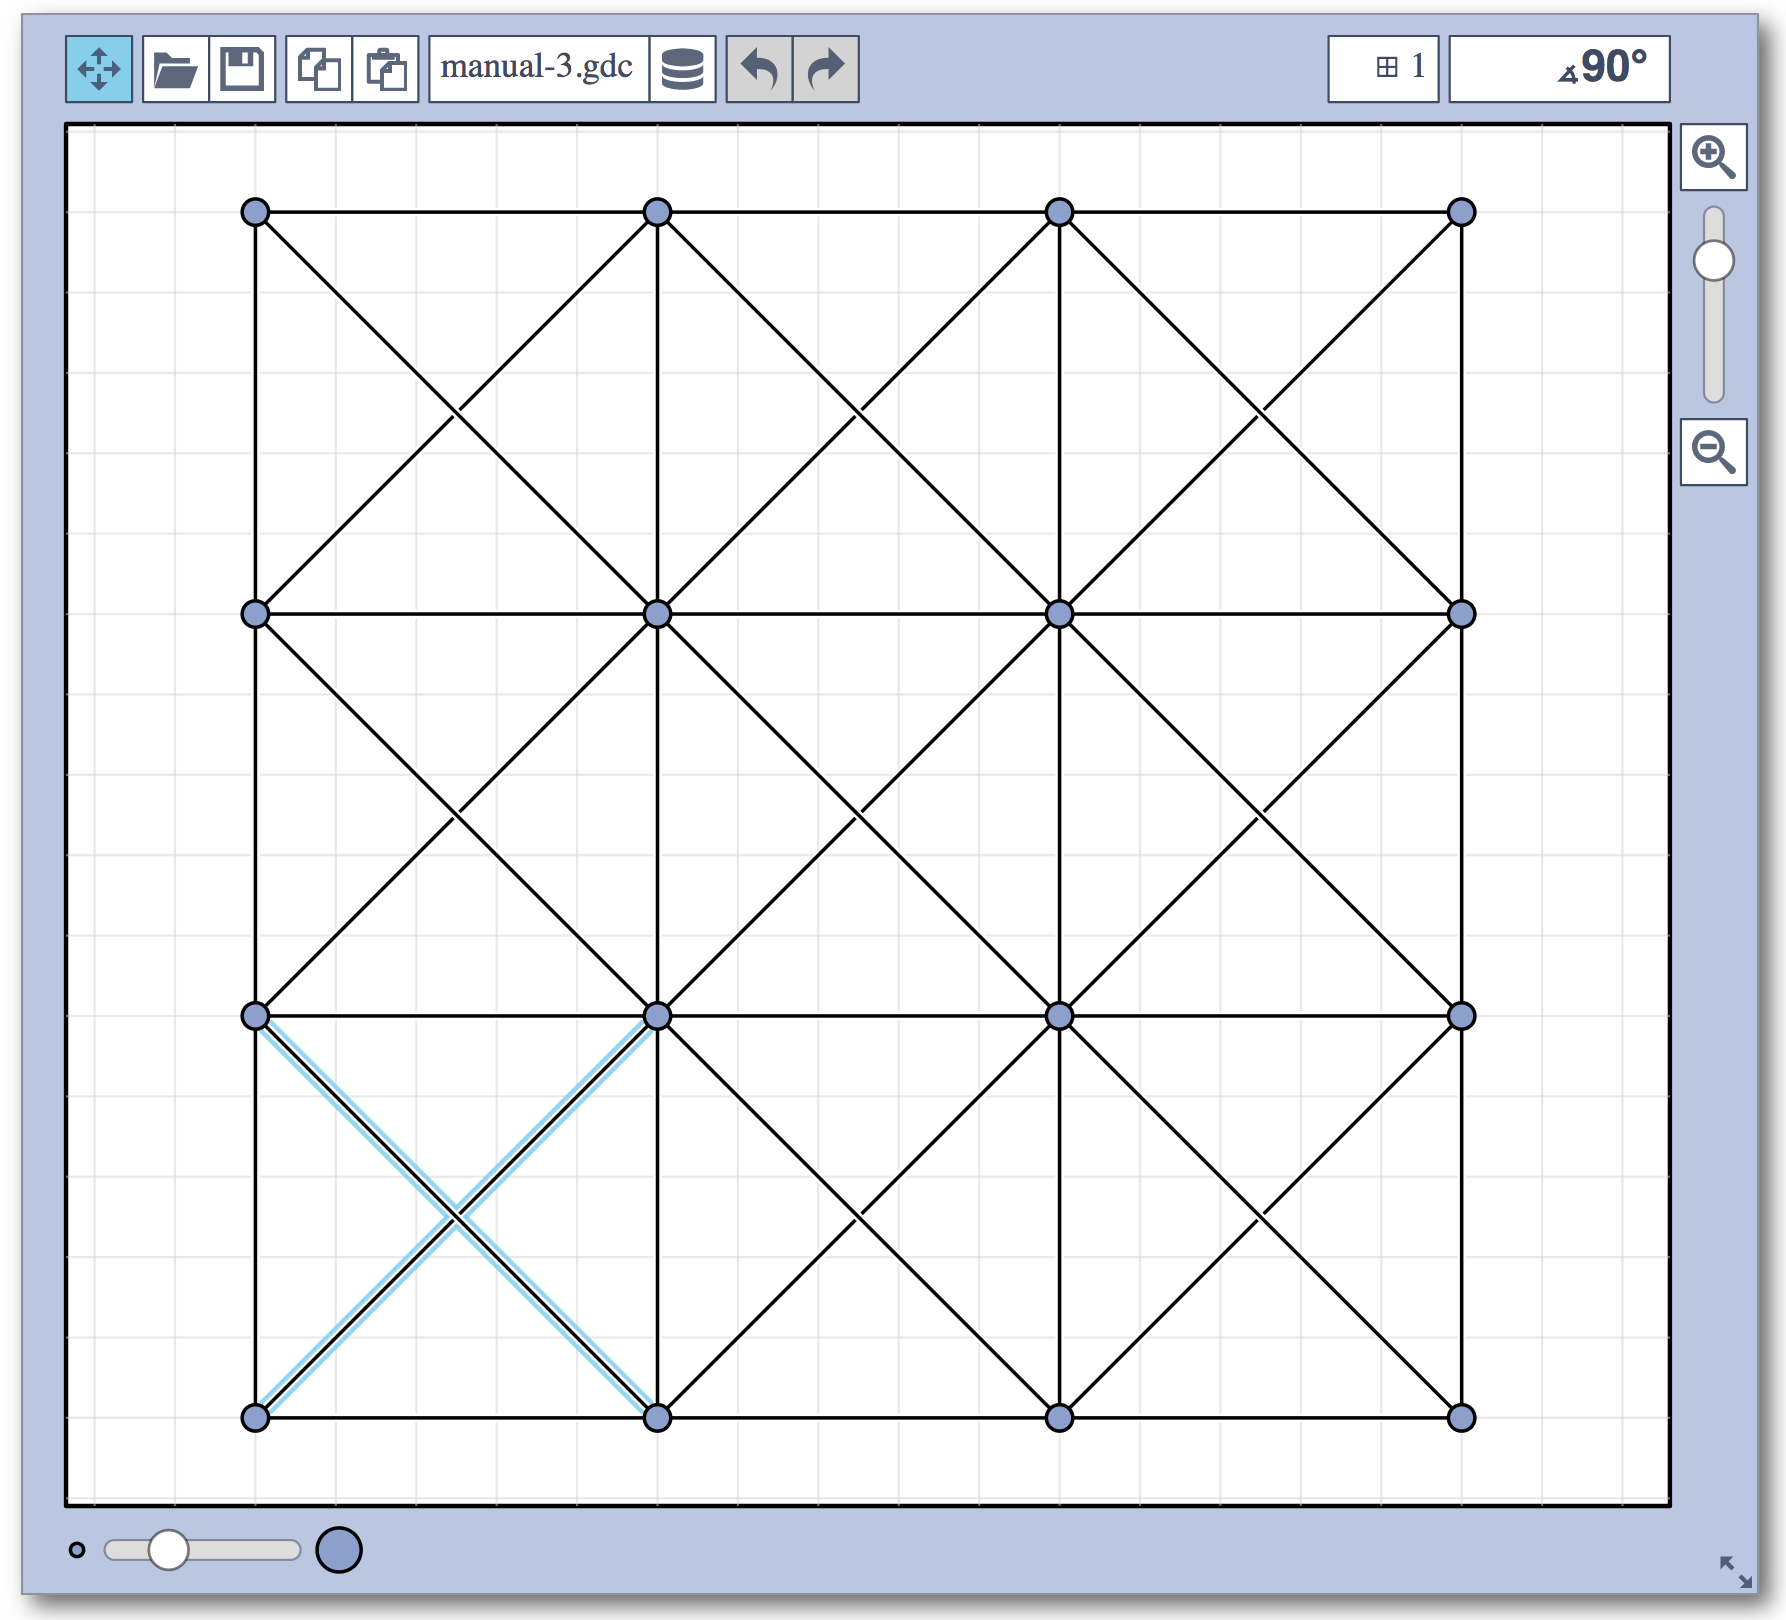
|
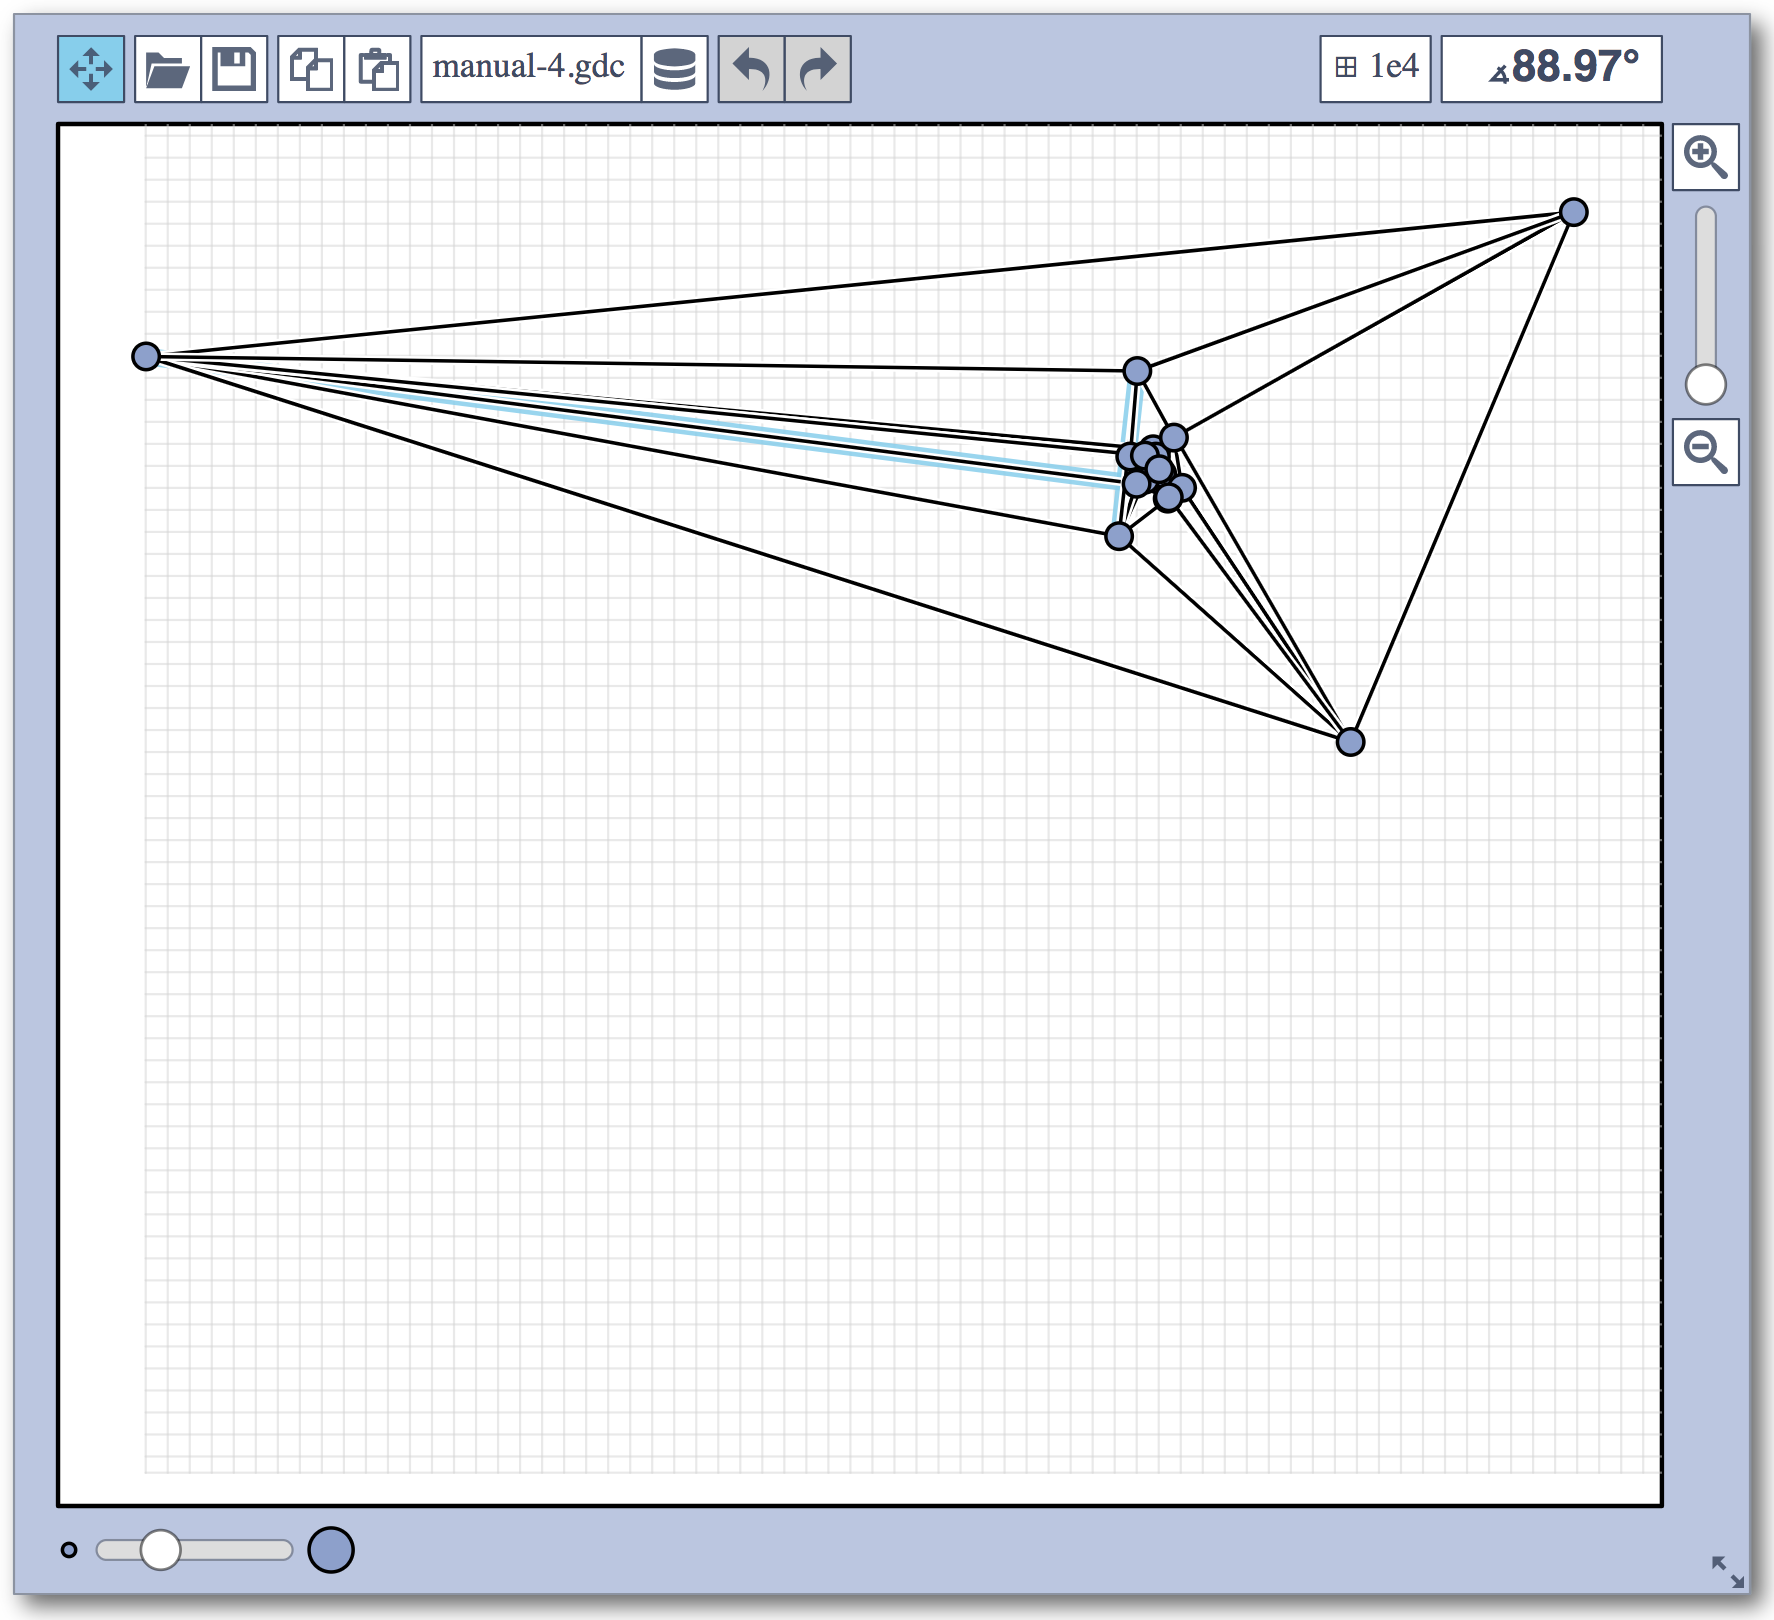
problem 4: input
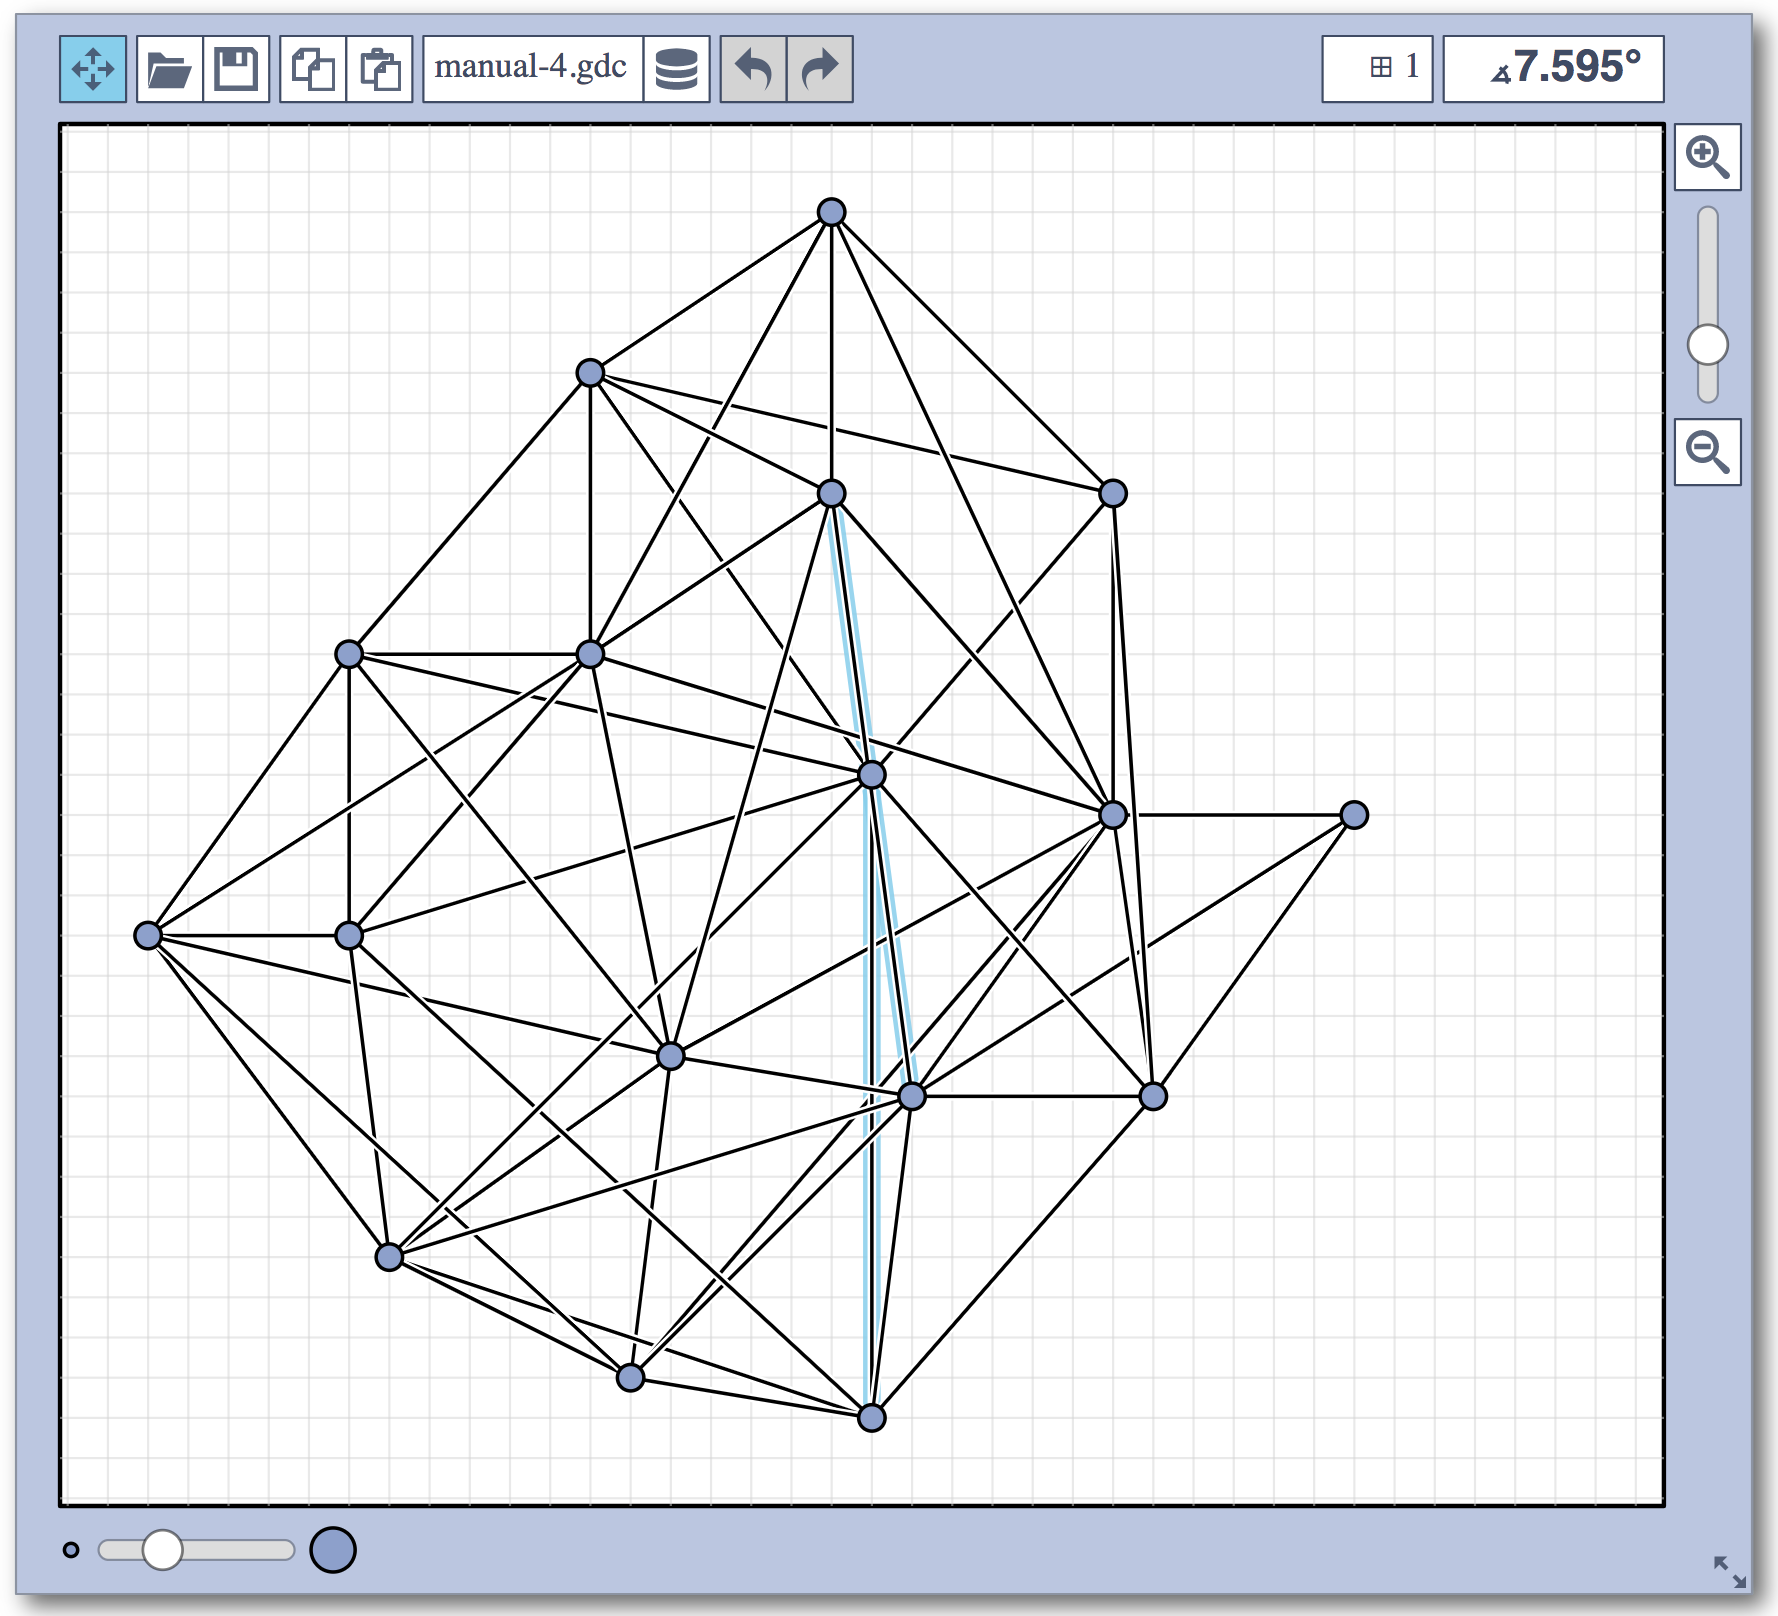
|
problem 4: best manual submission
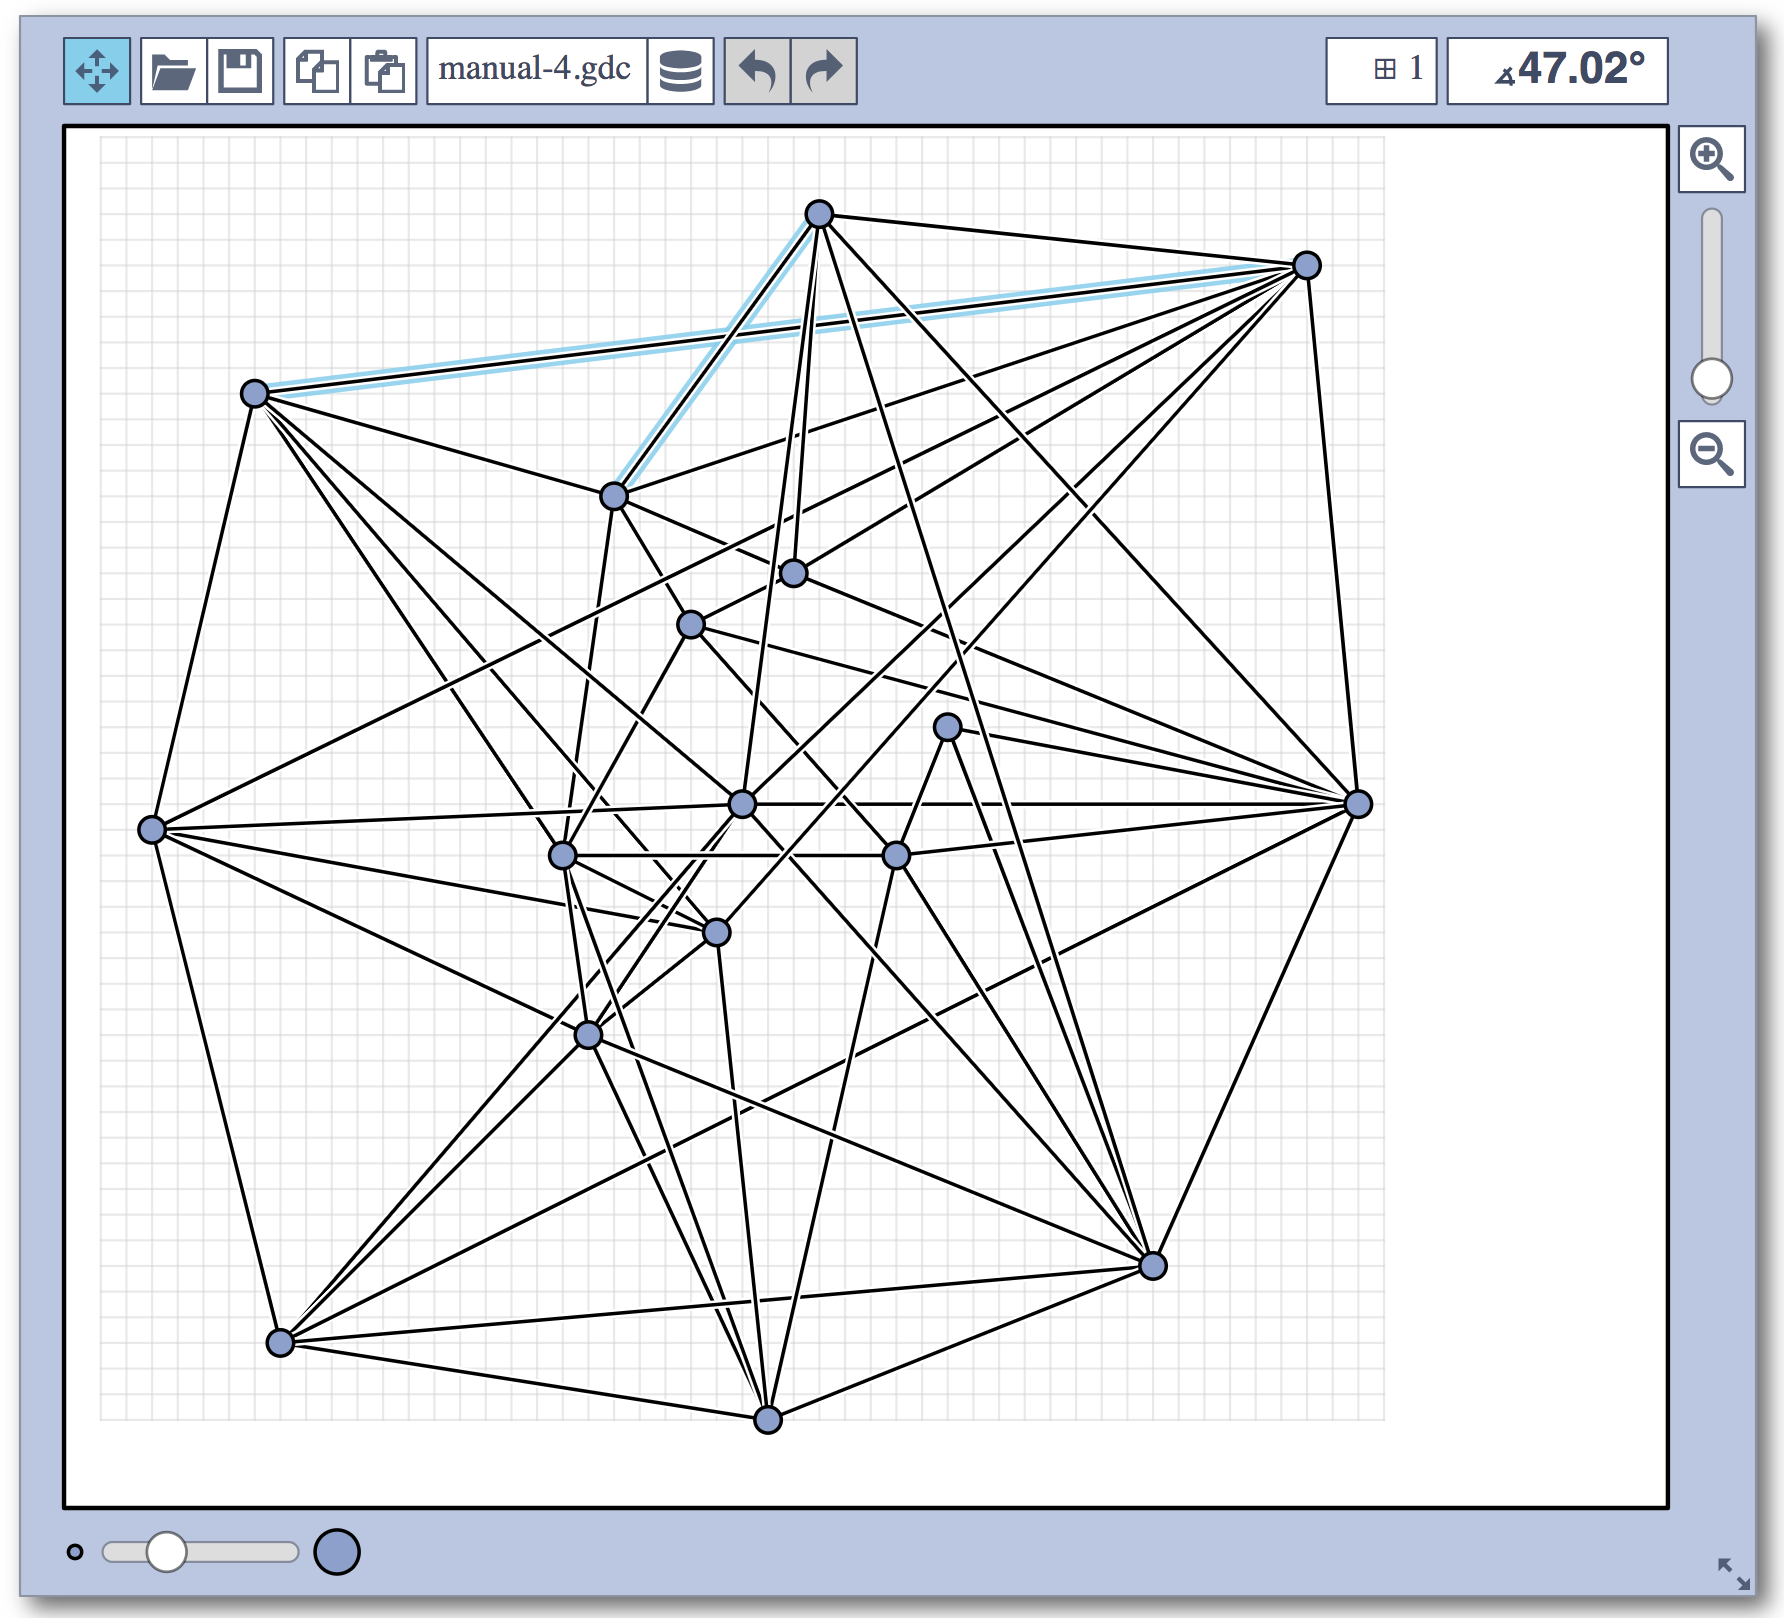
|
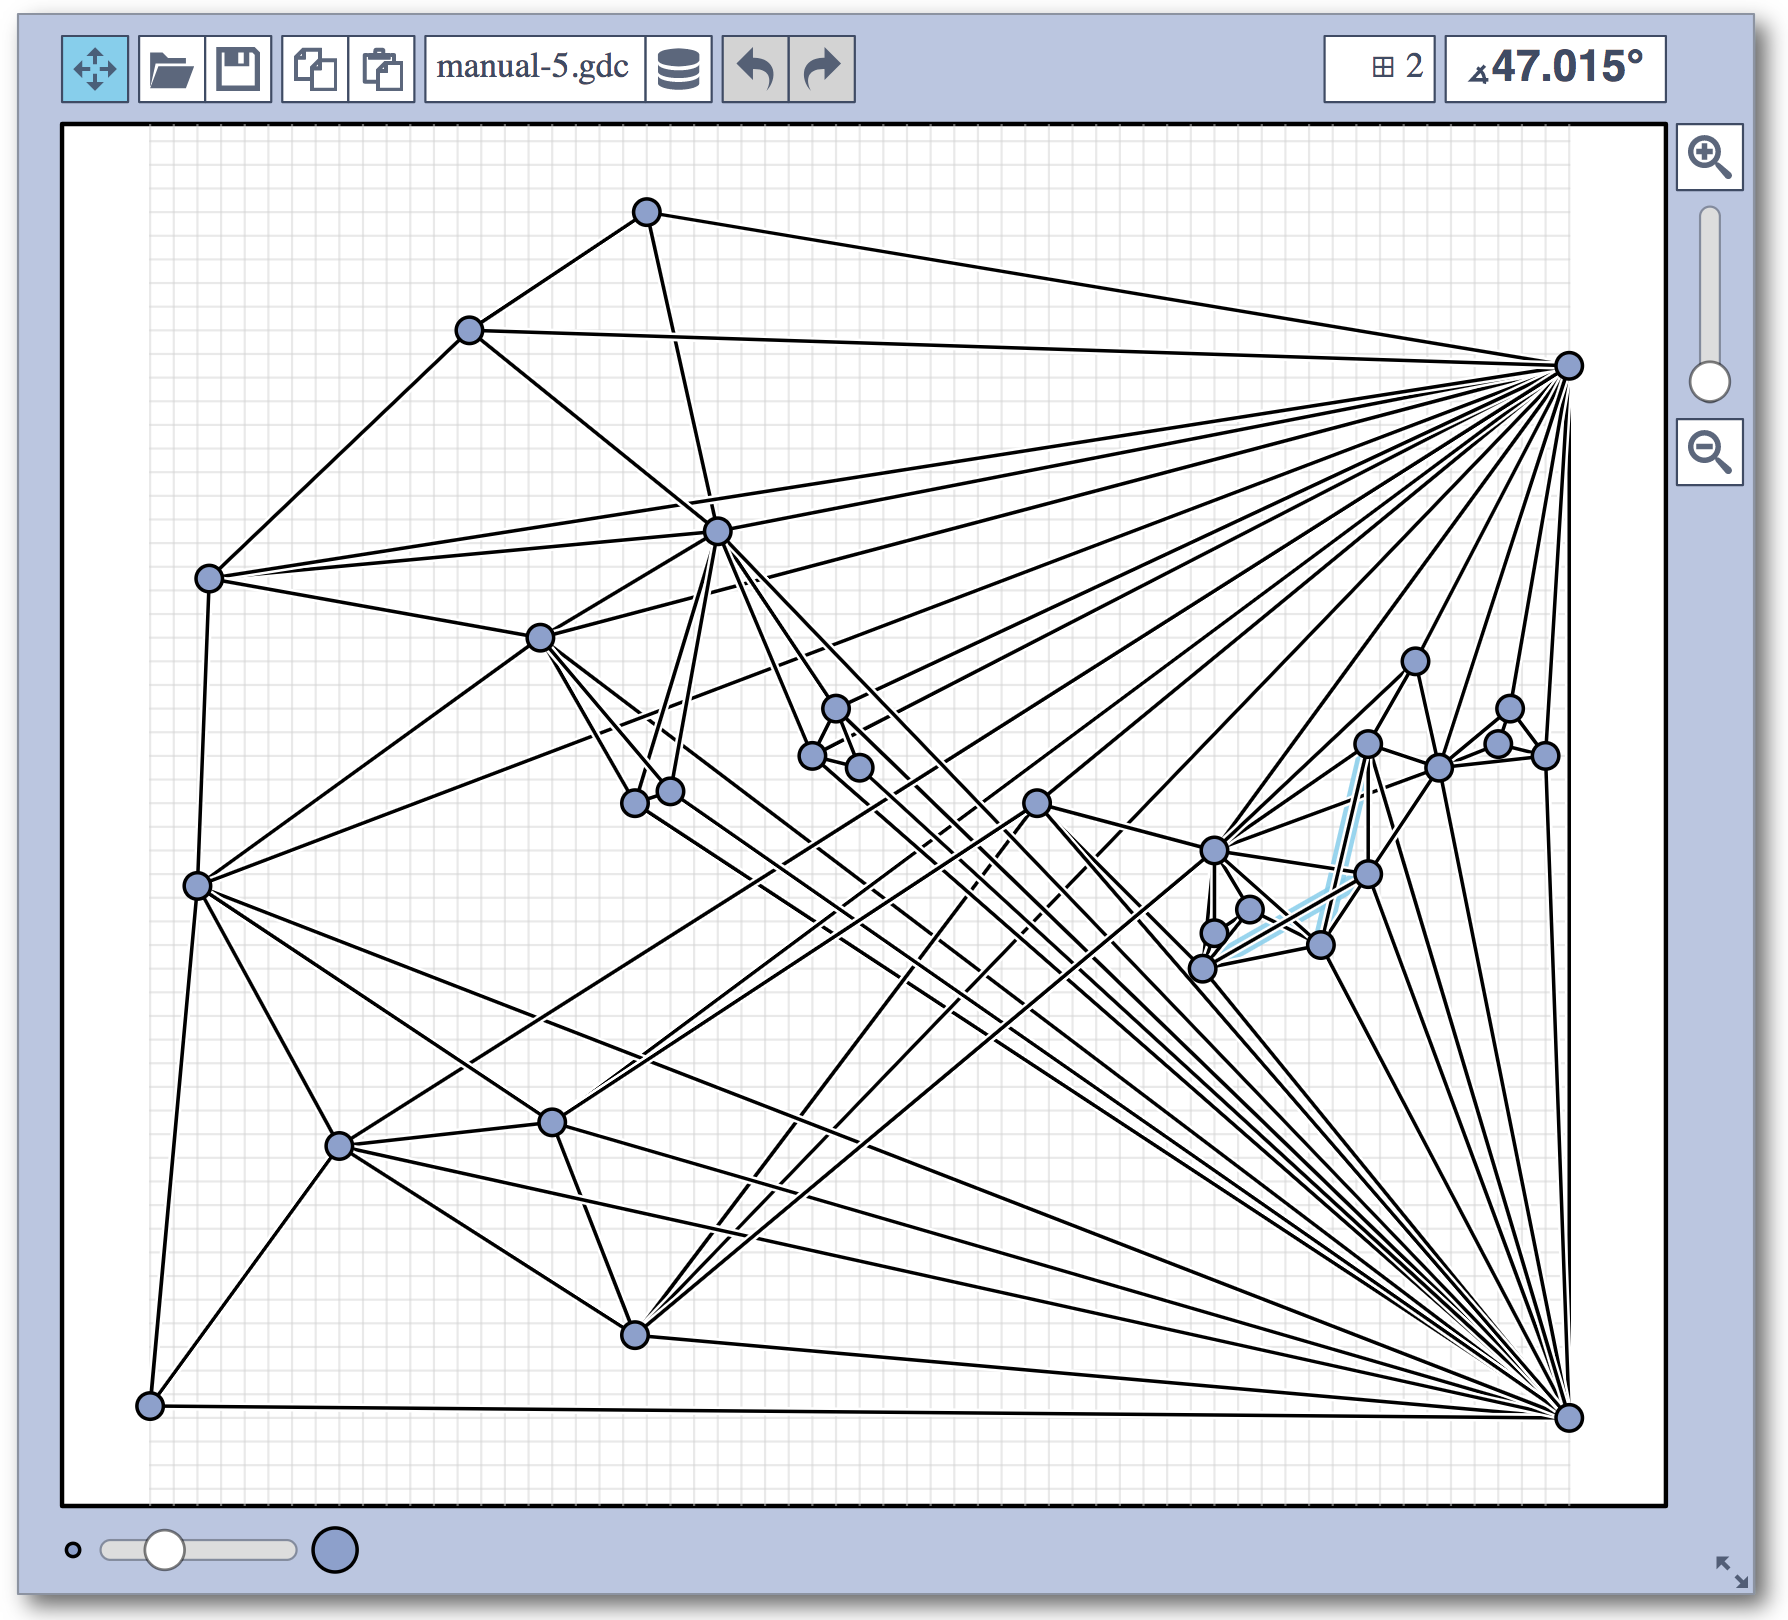
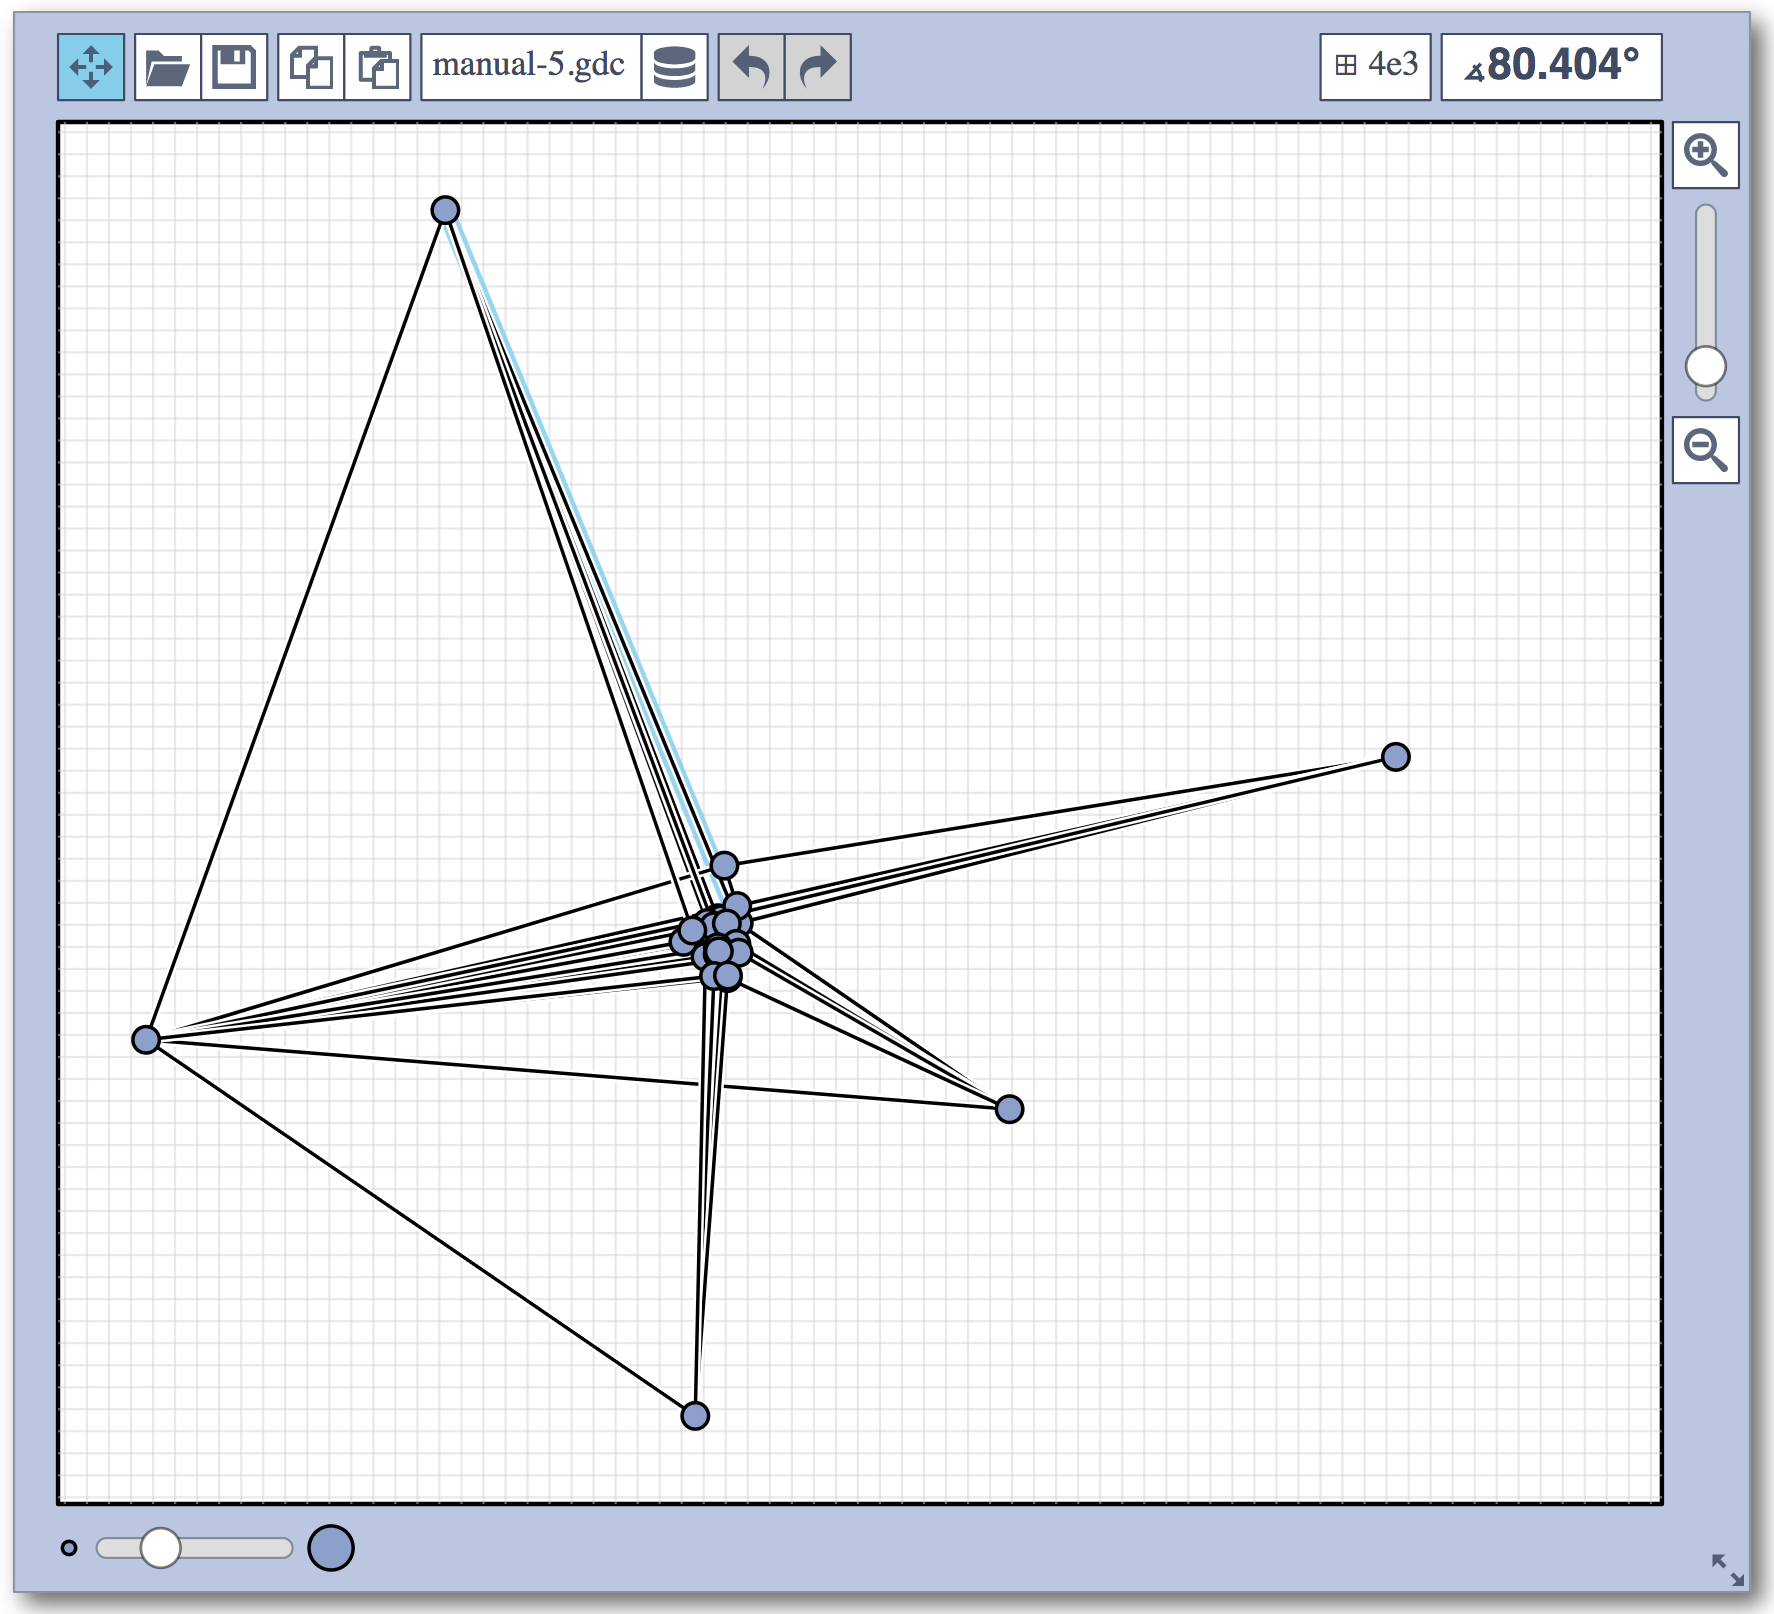
problem 5: input
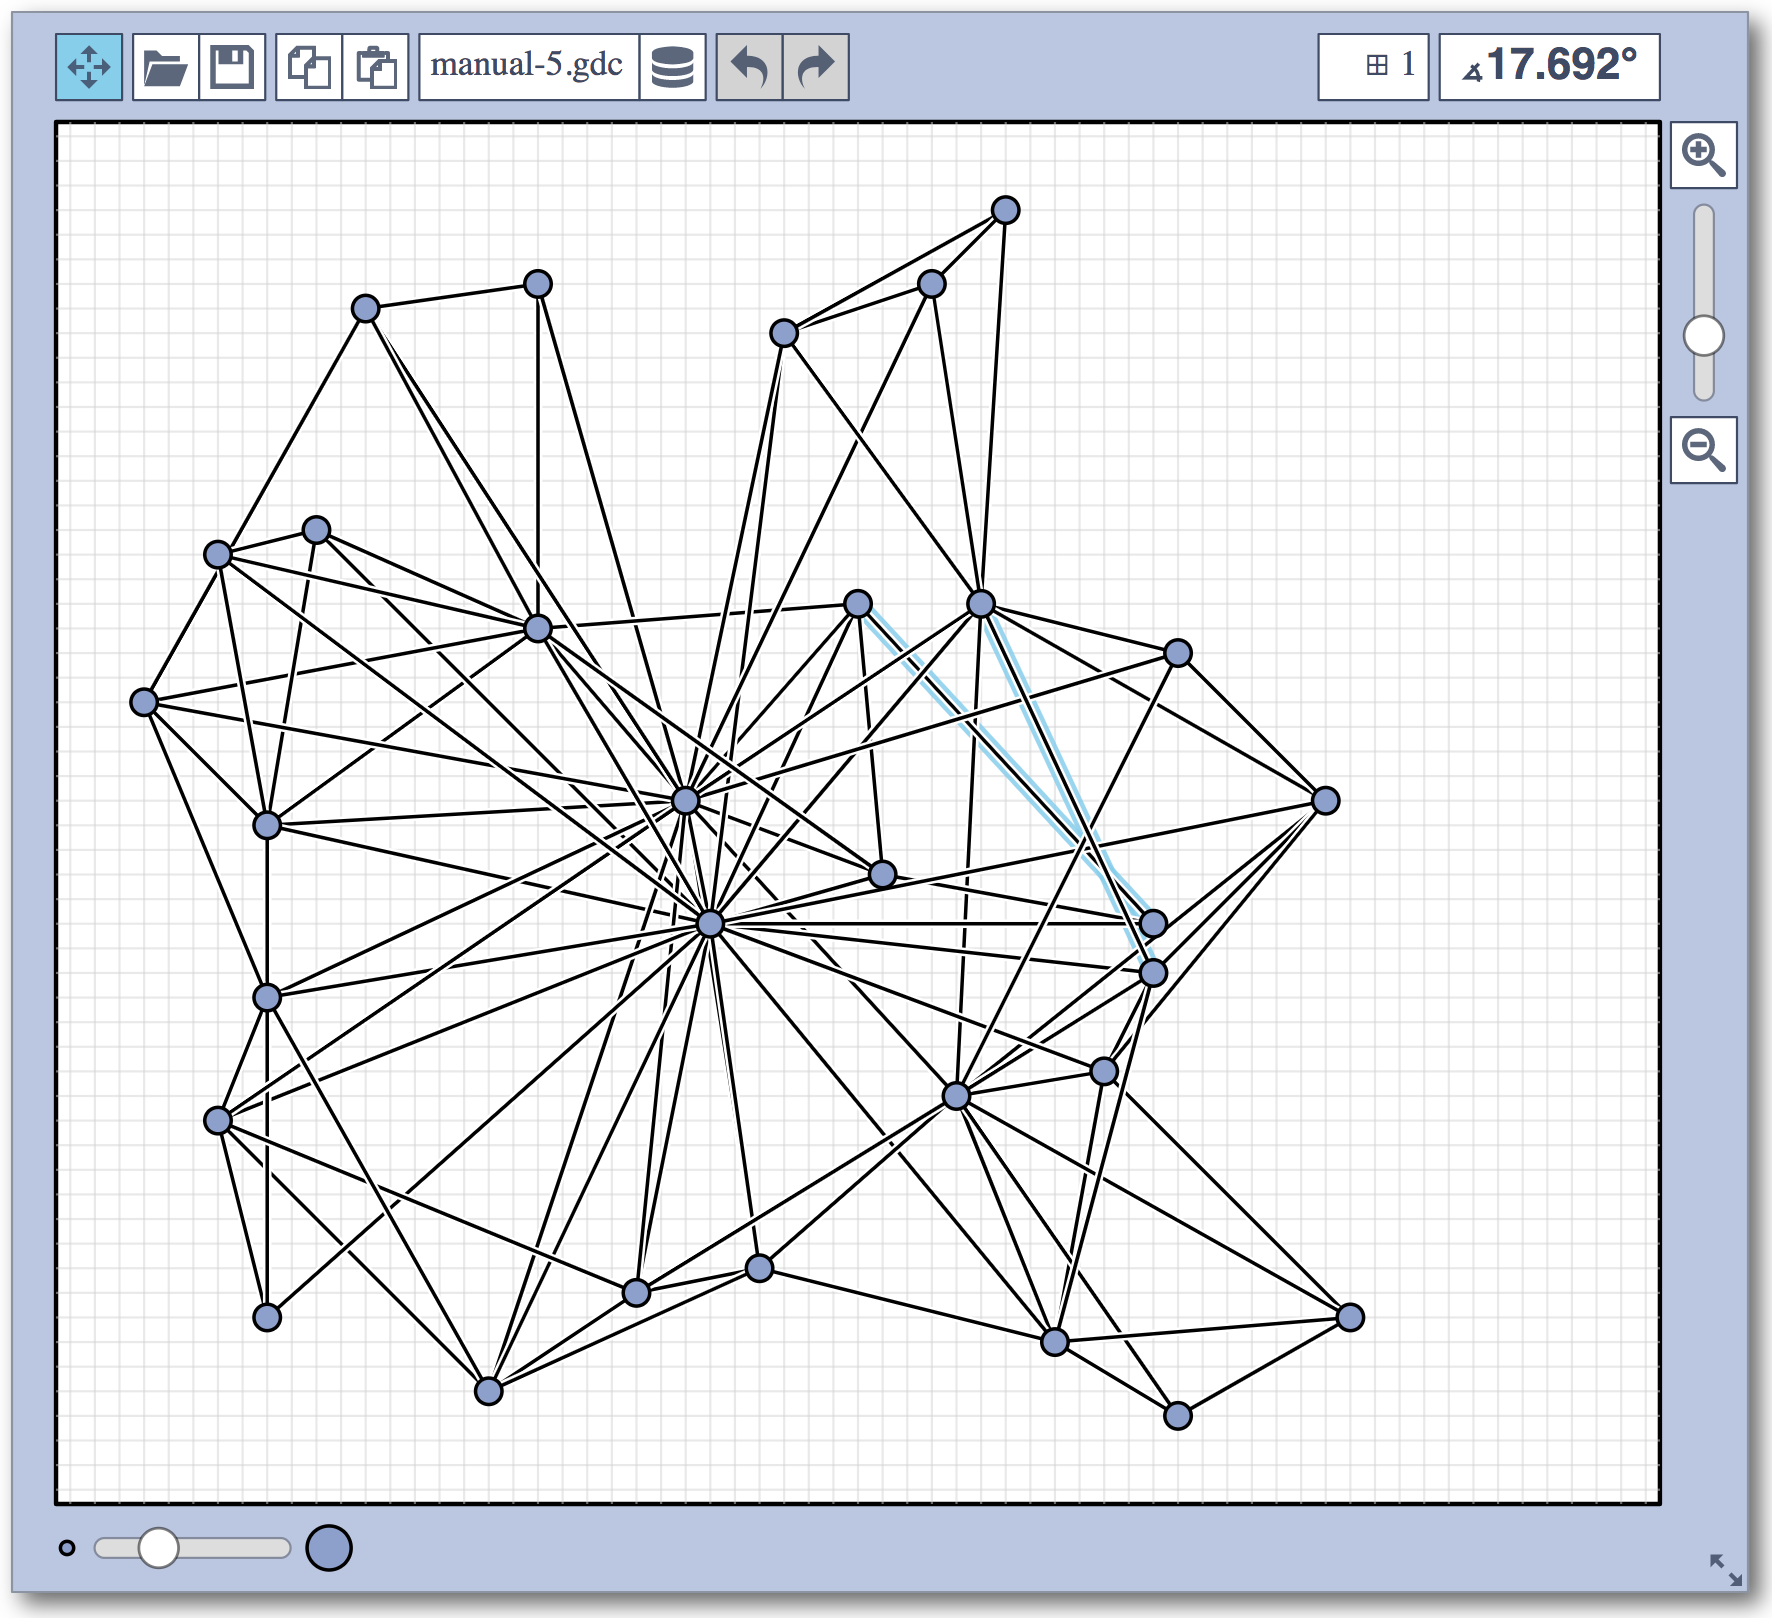
|
problem 5: best manual submission
|
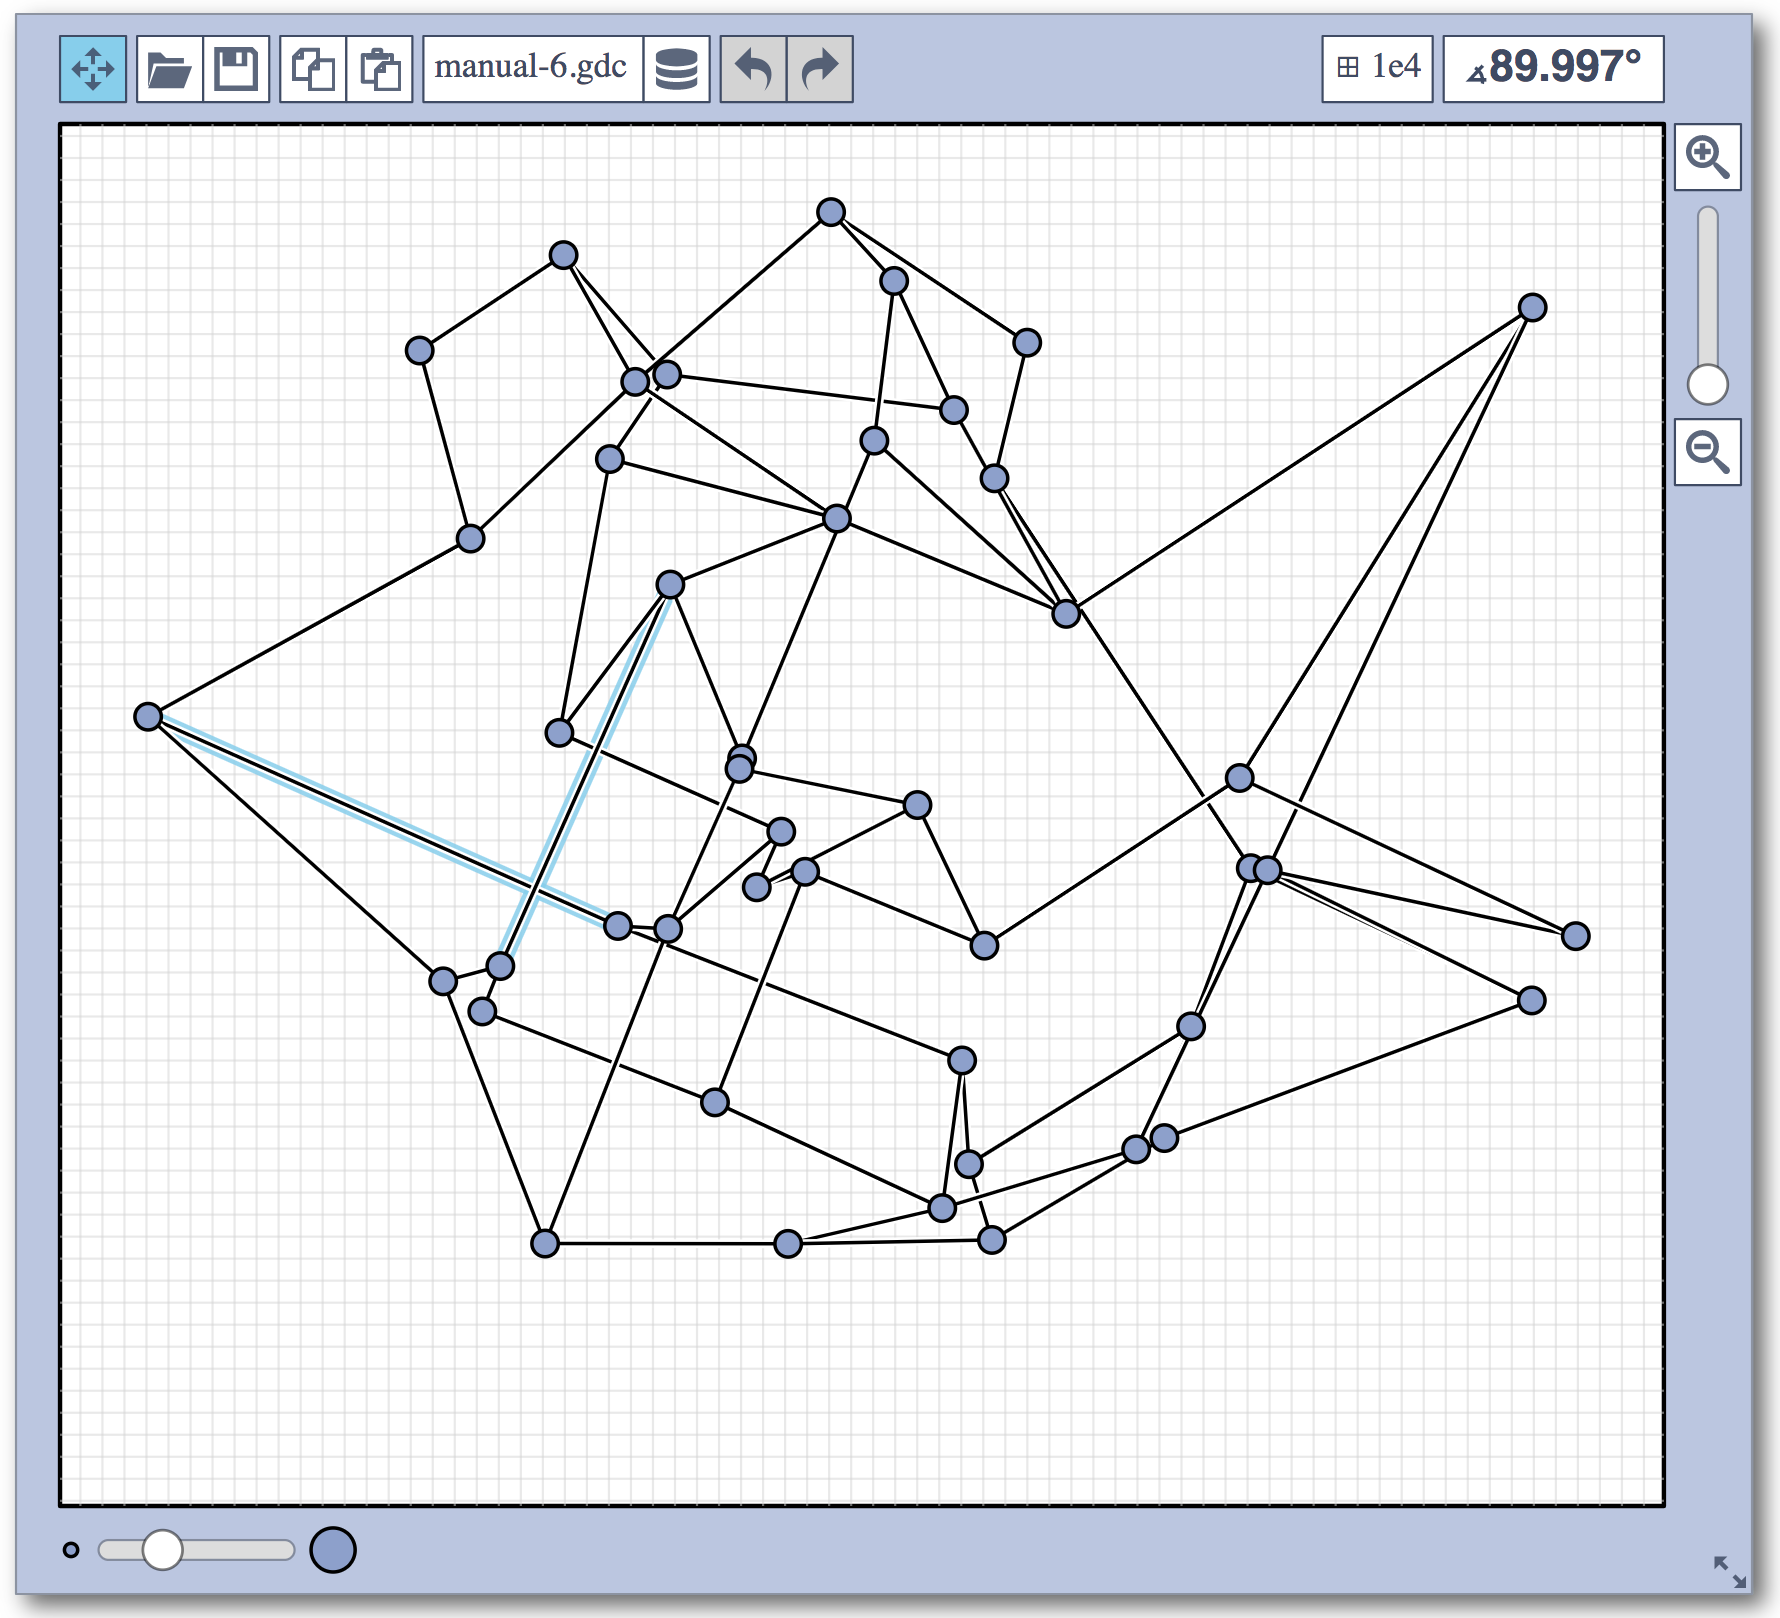
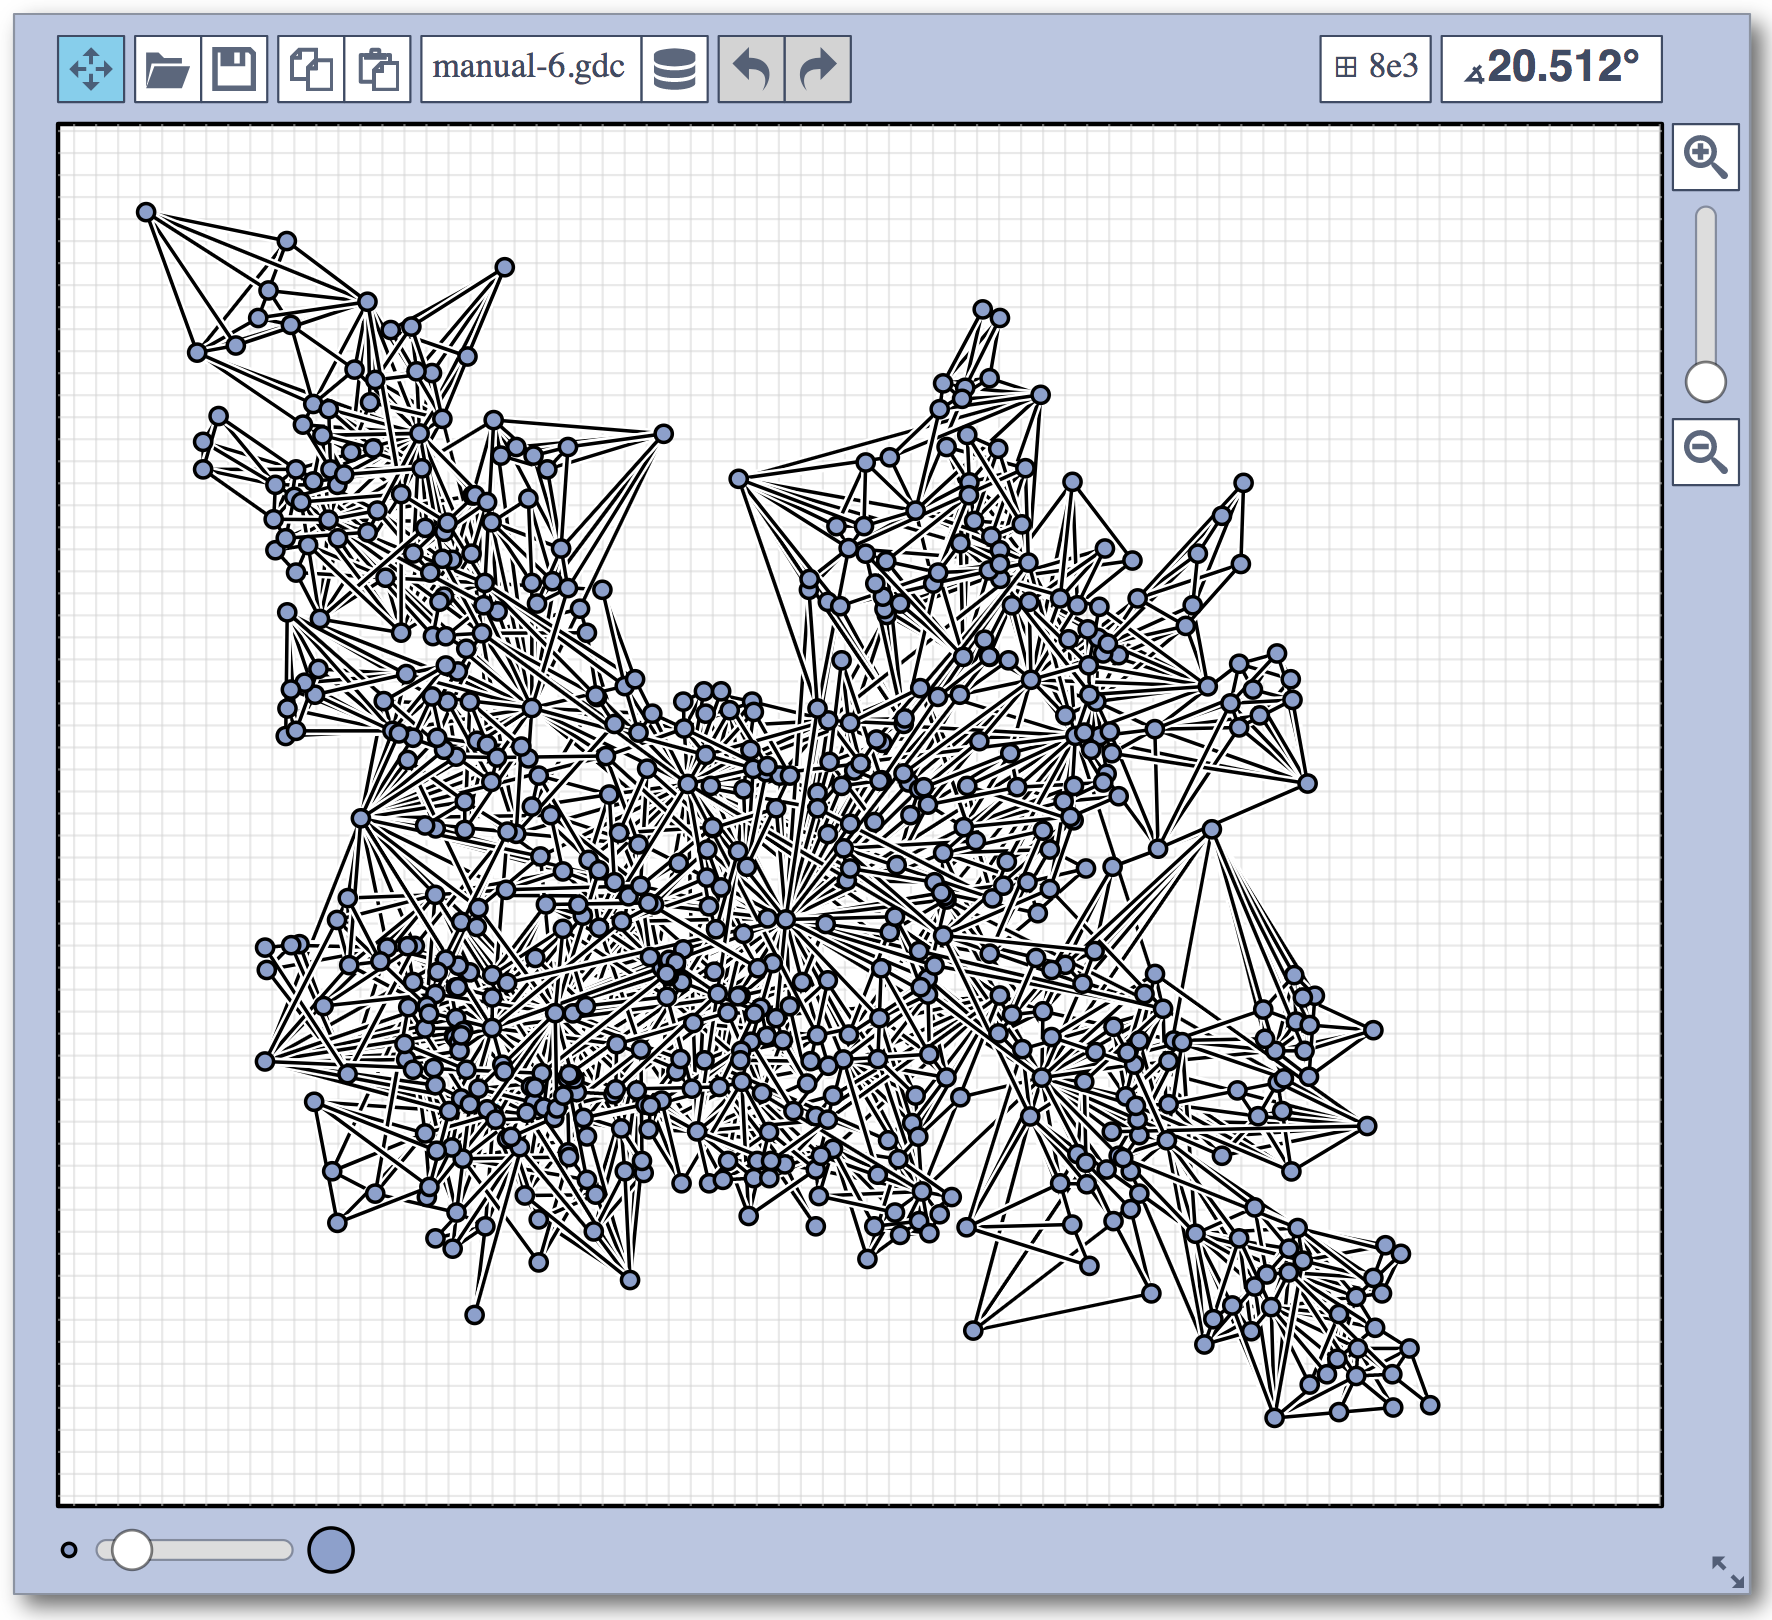
problem 6: input
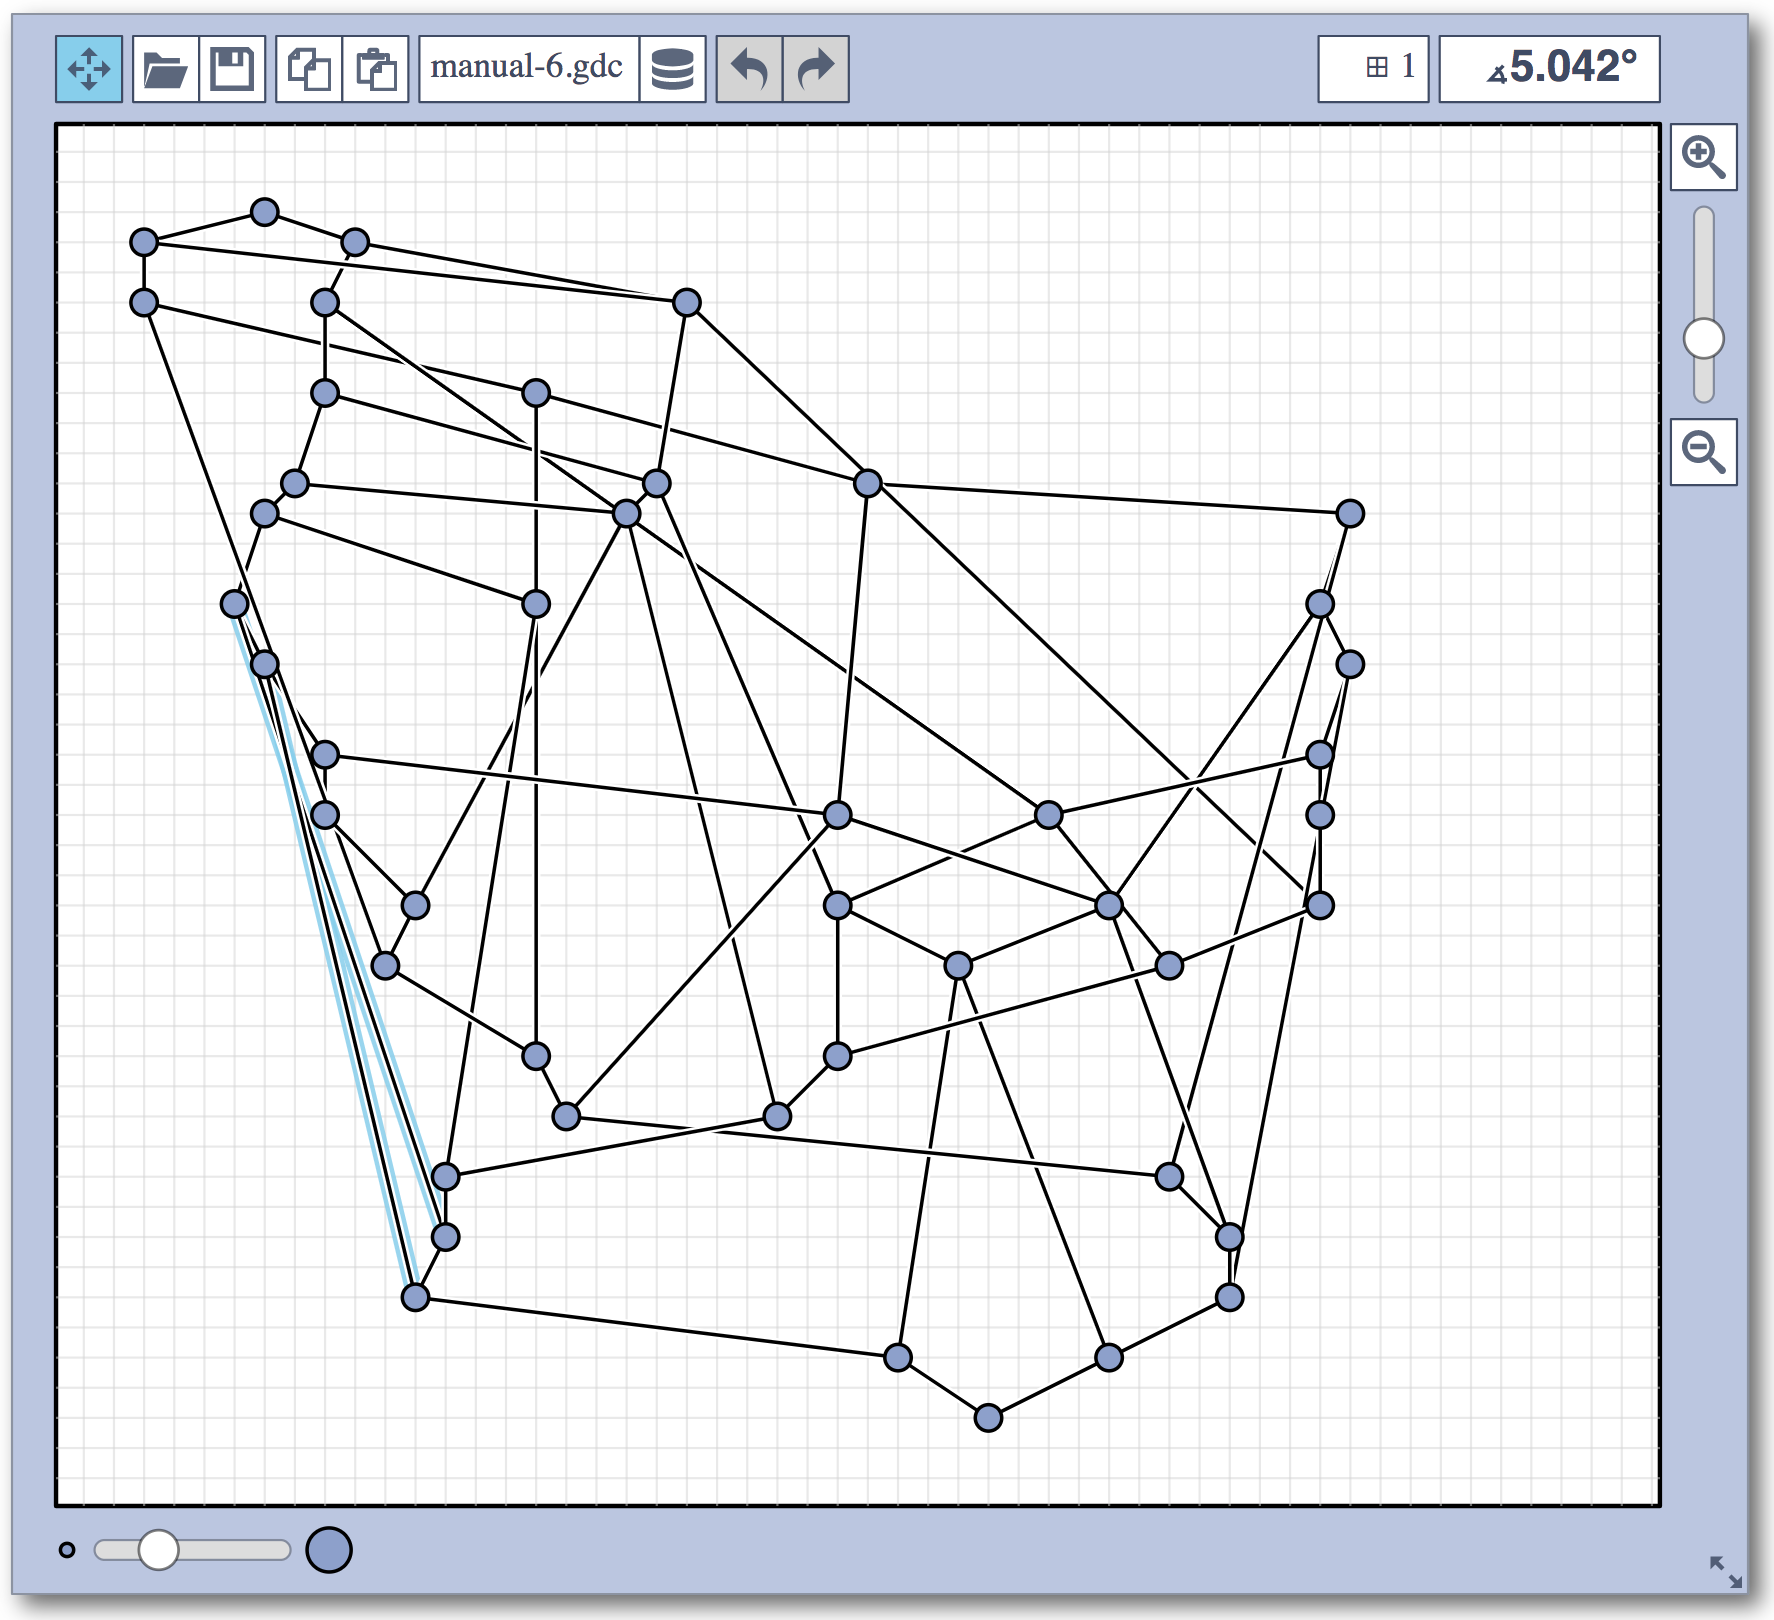
|
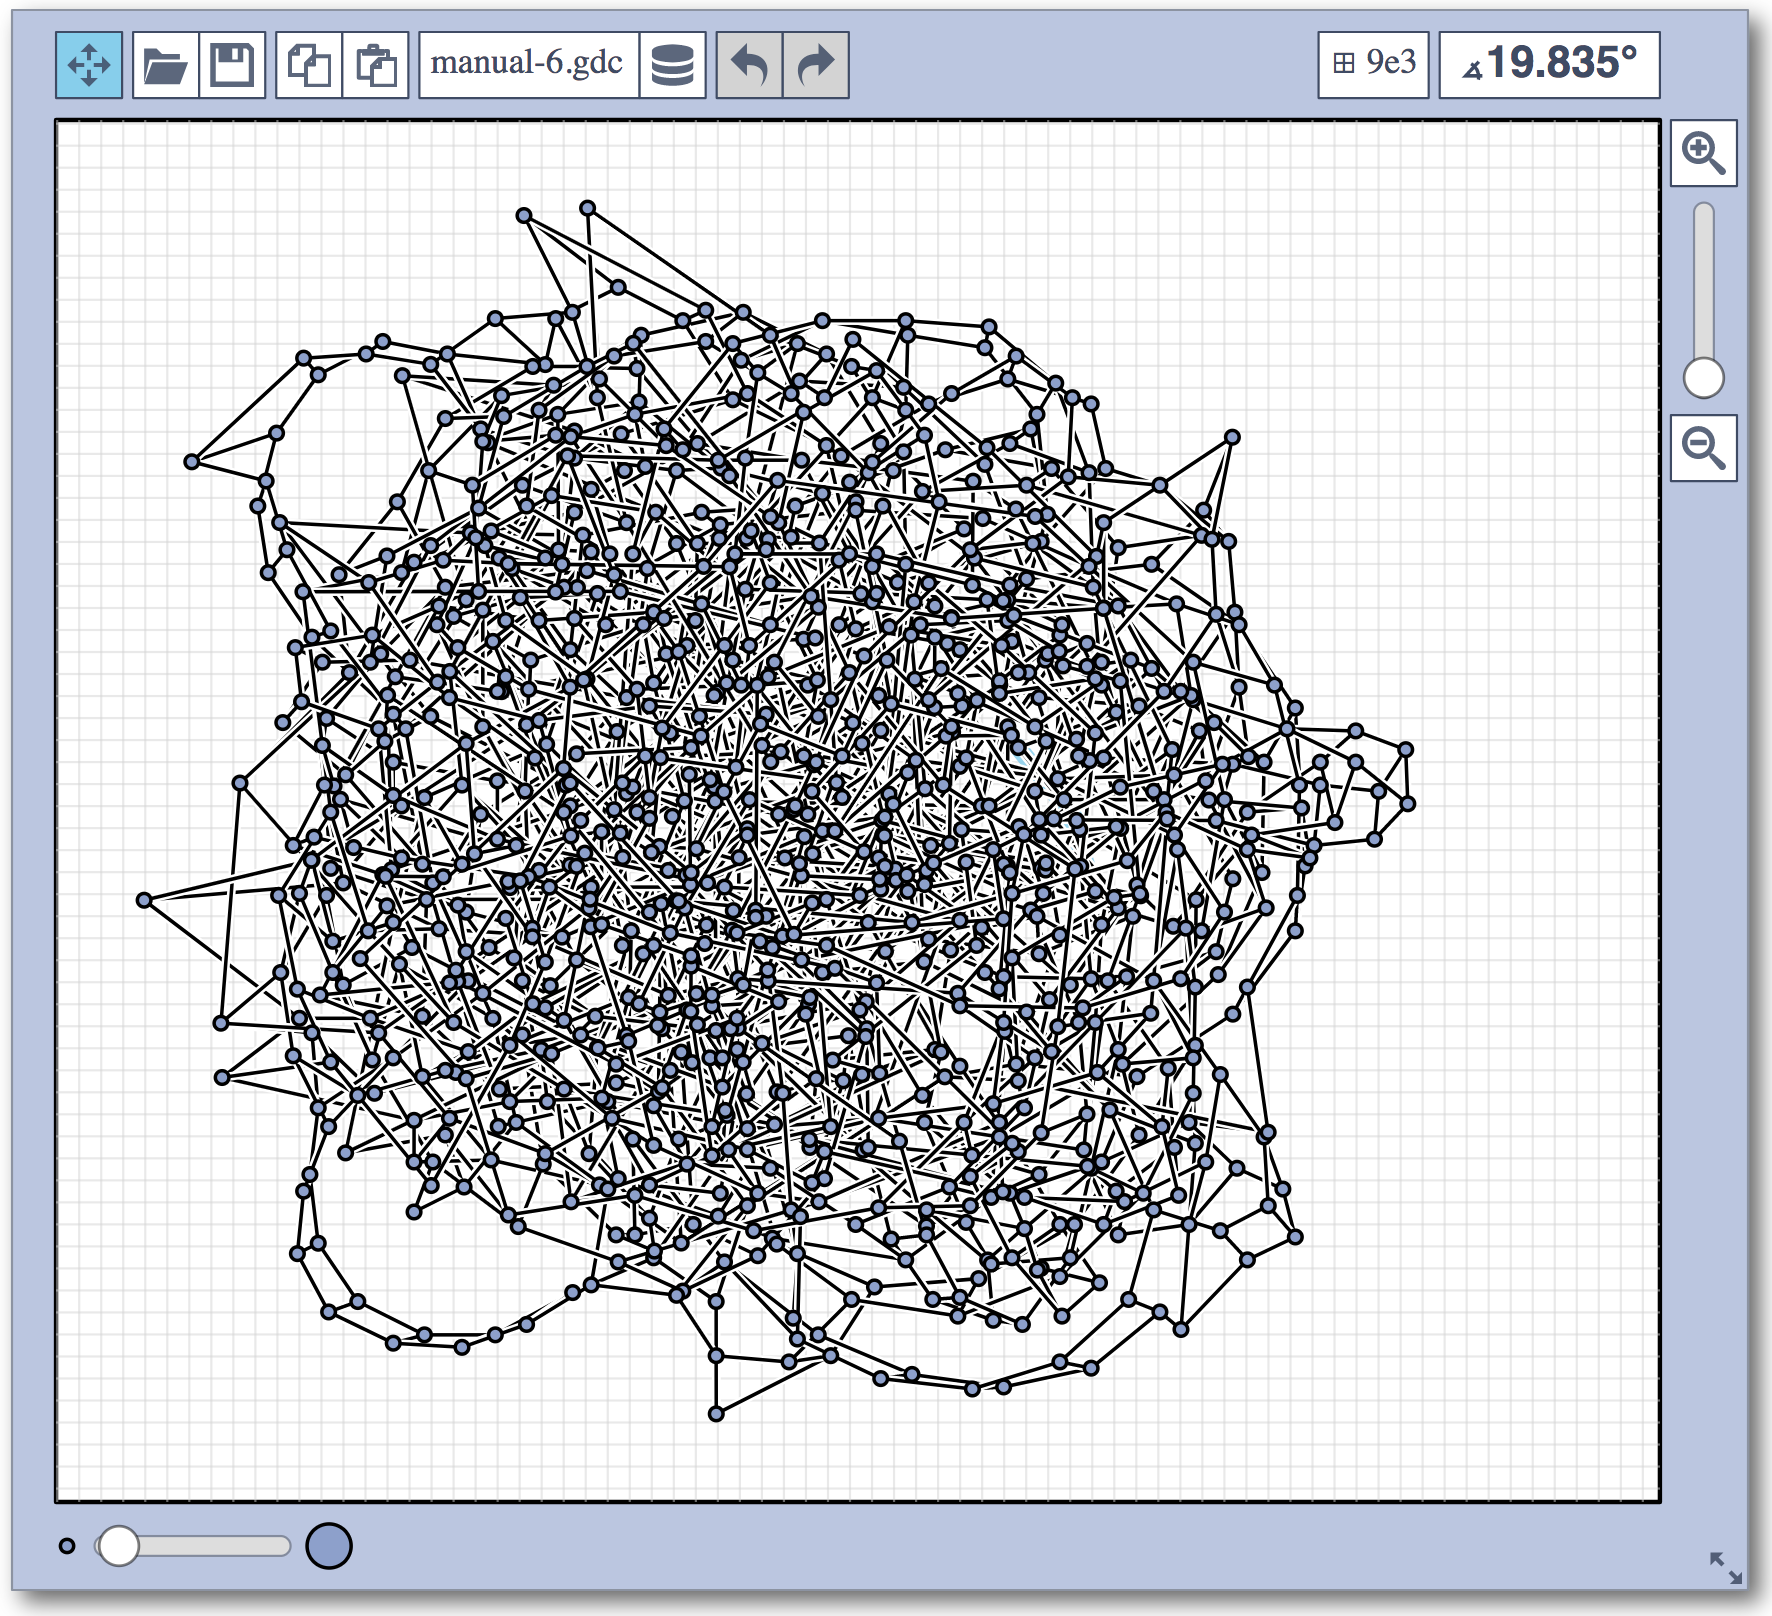
problem 6: best manual submission
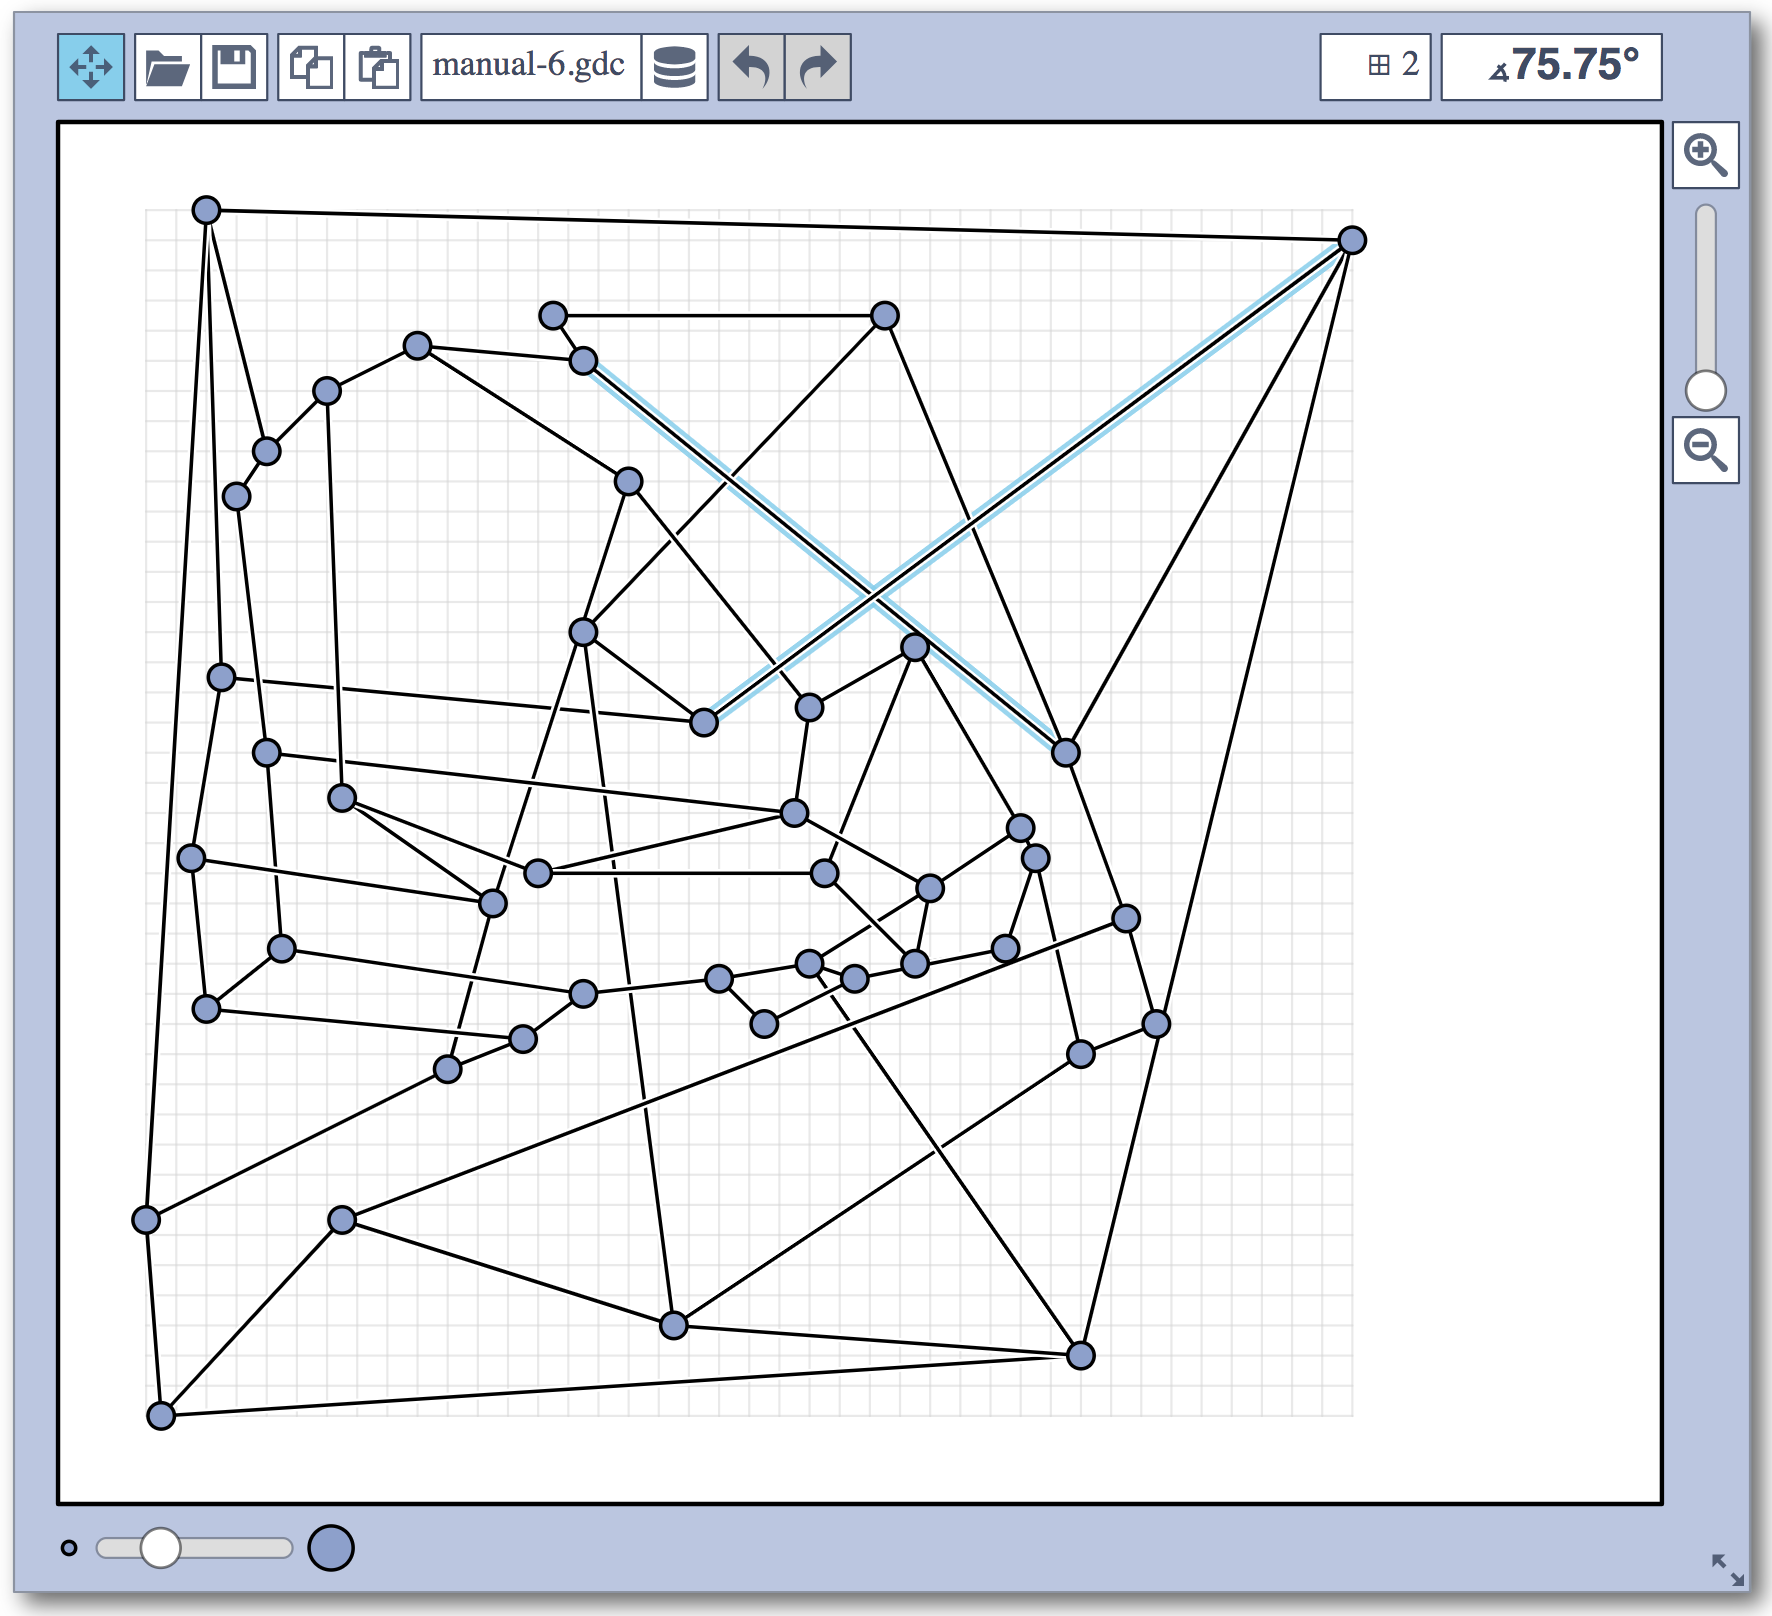
|
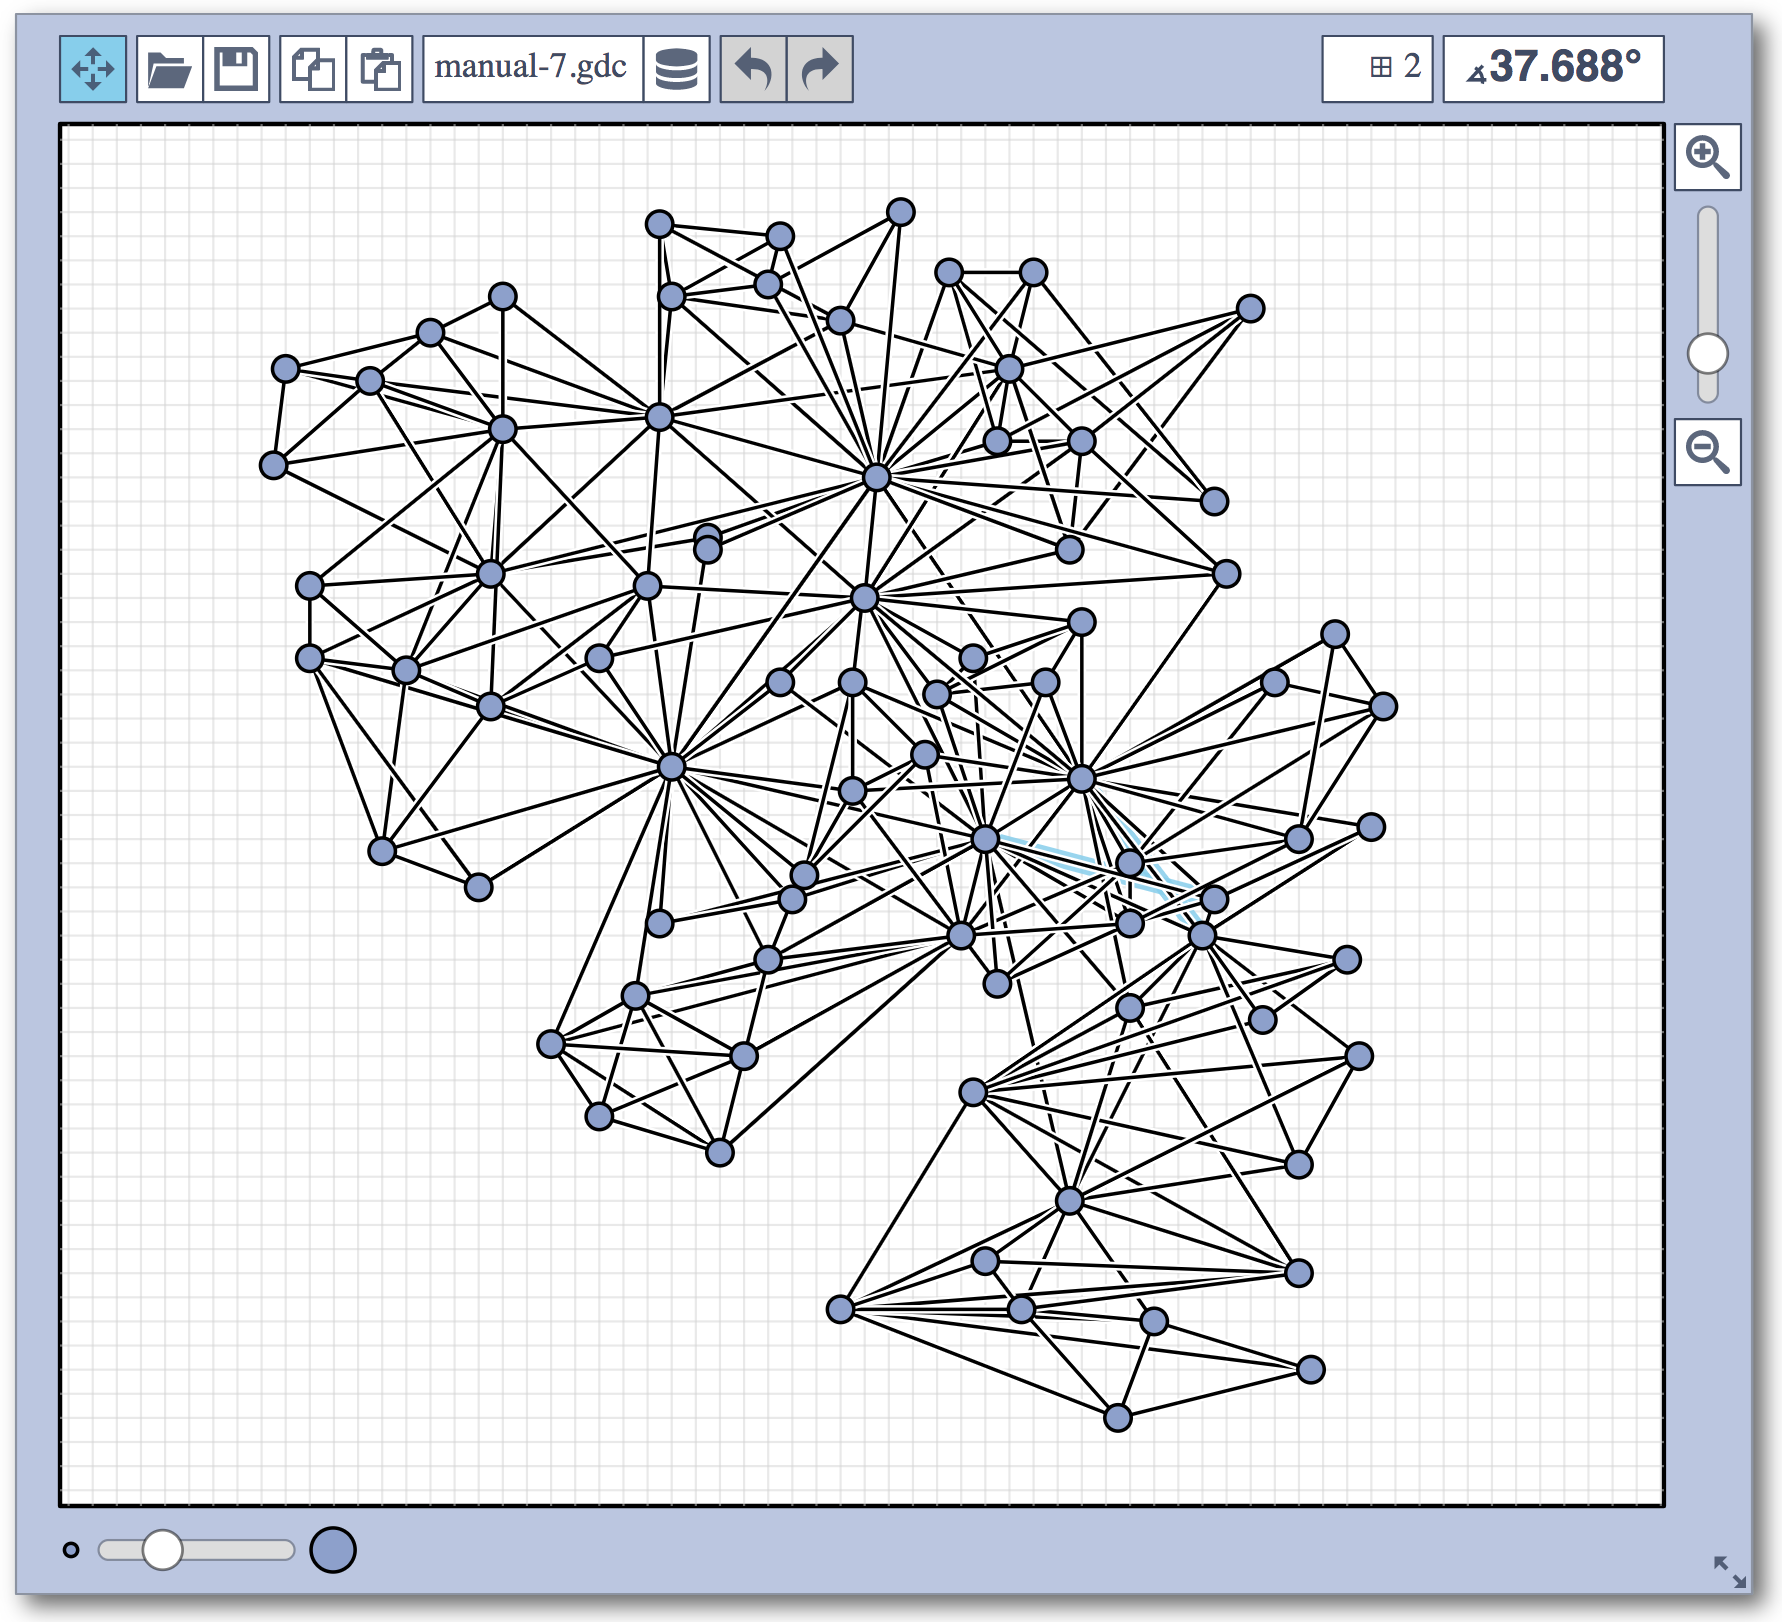
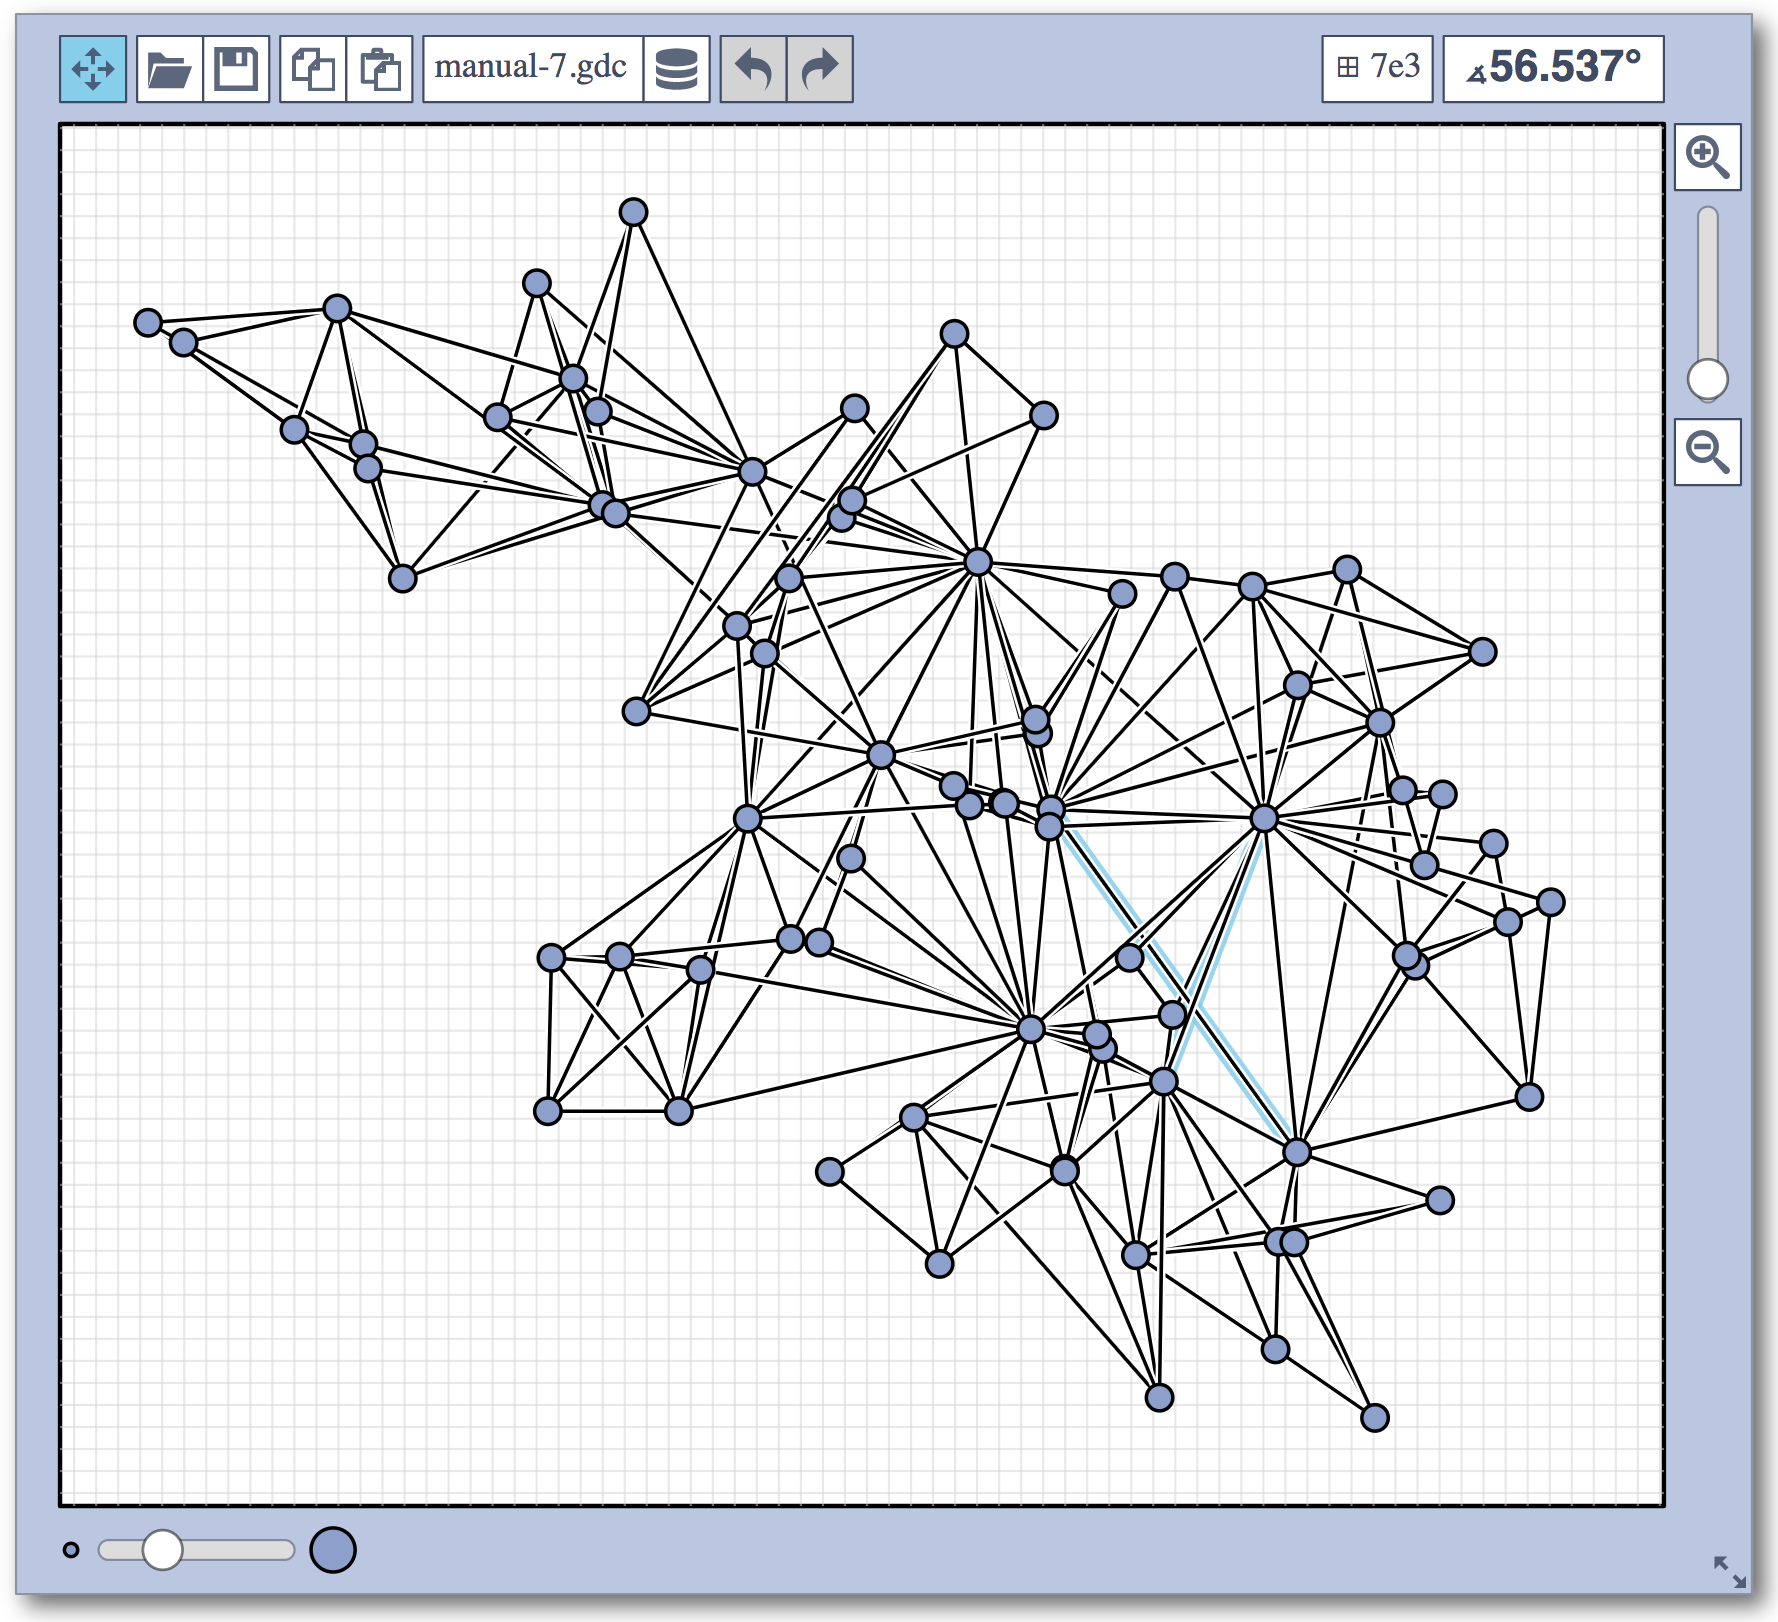
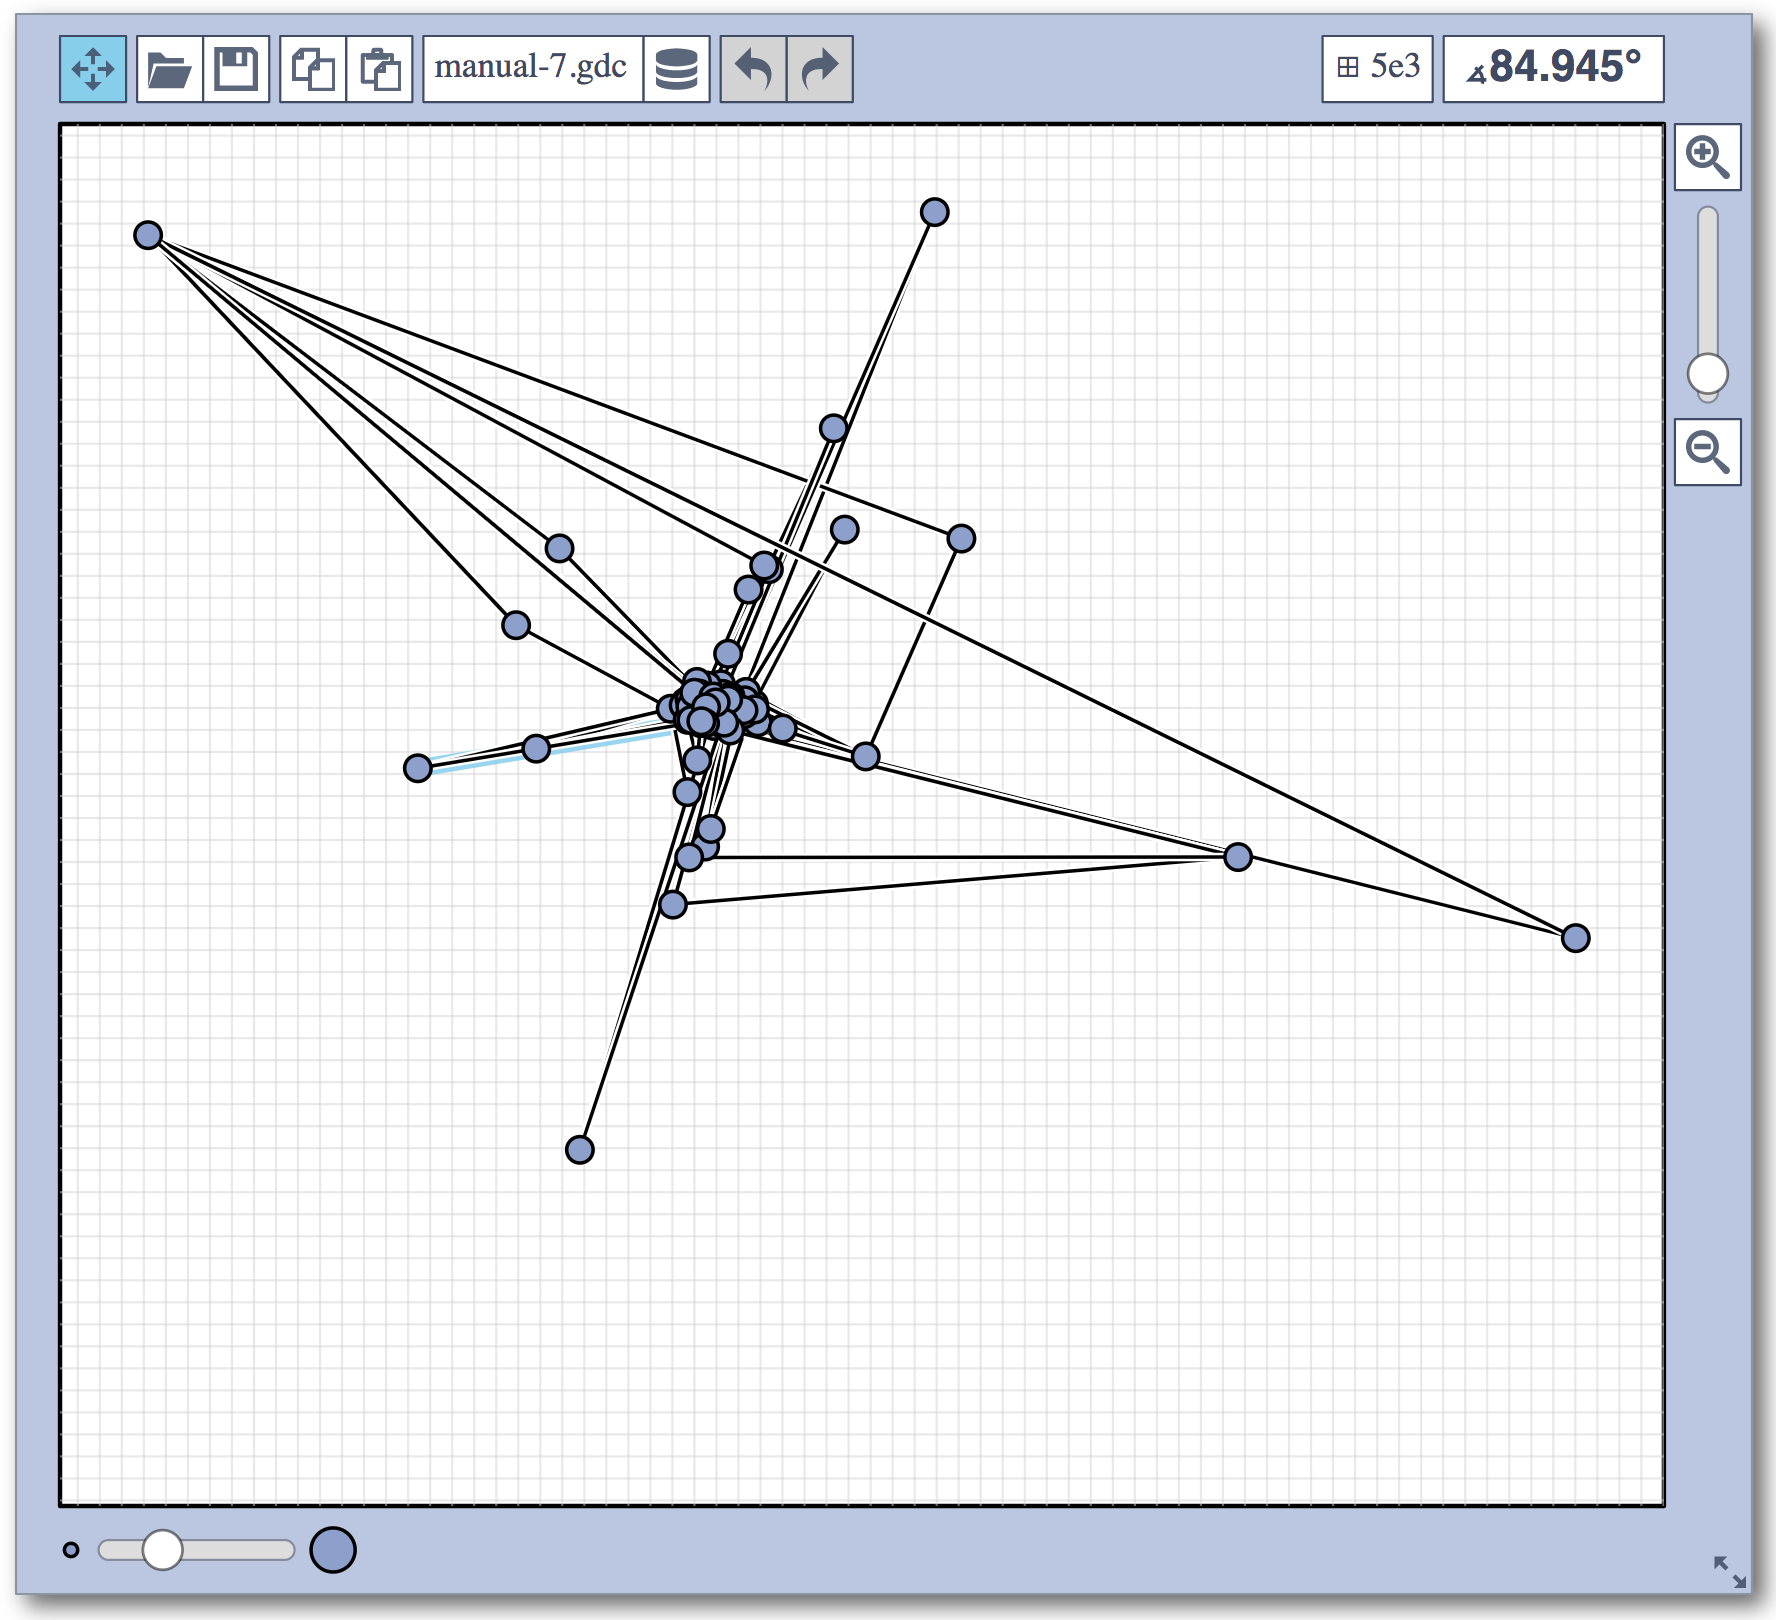
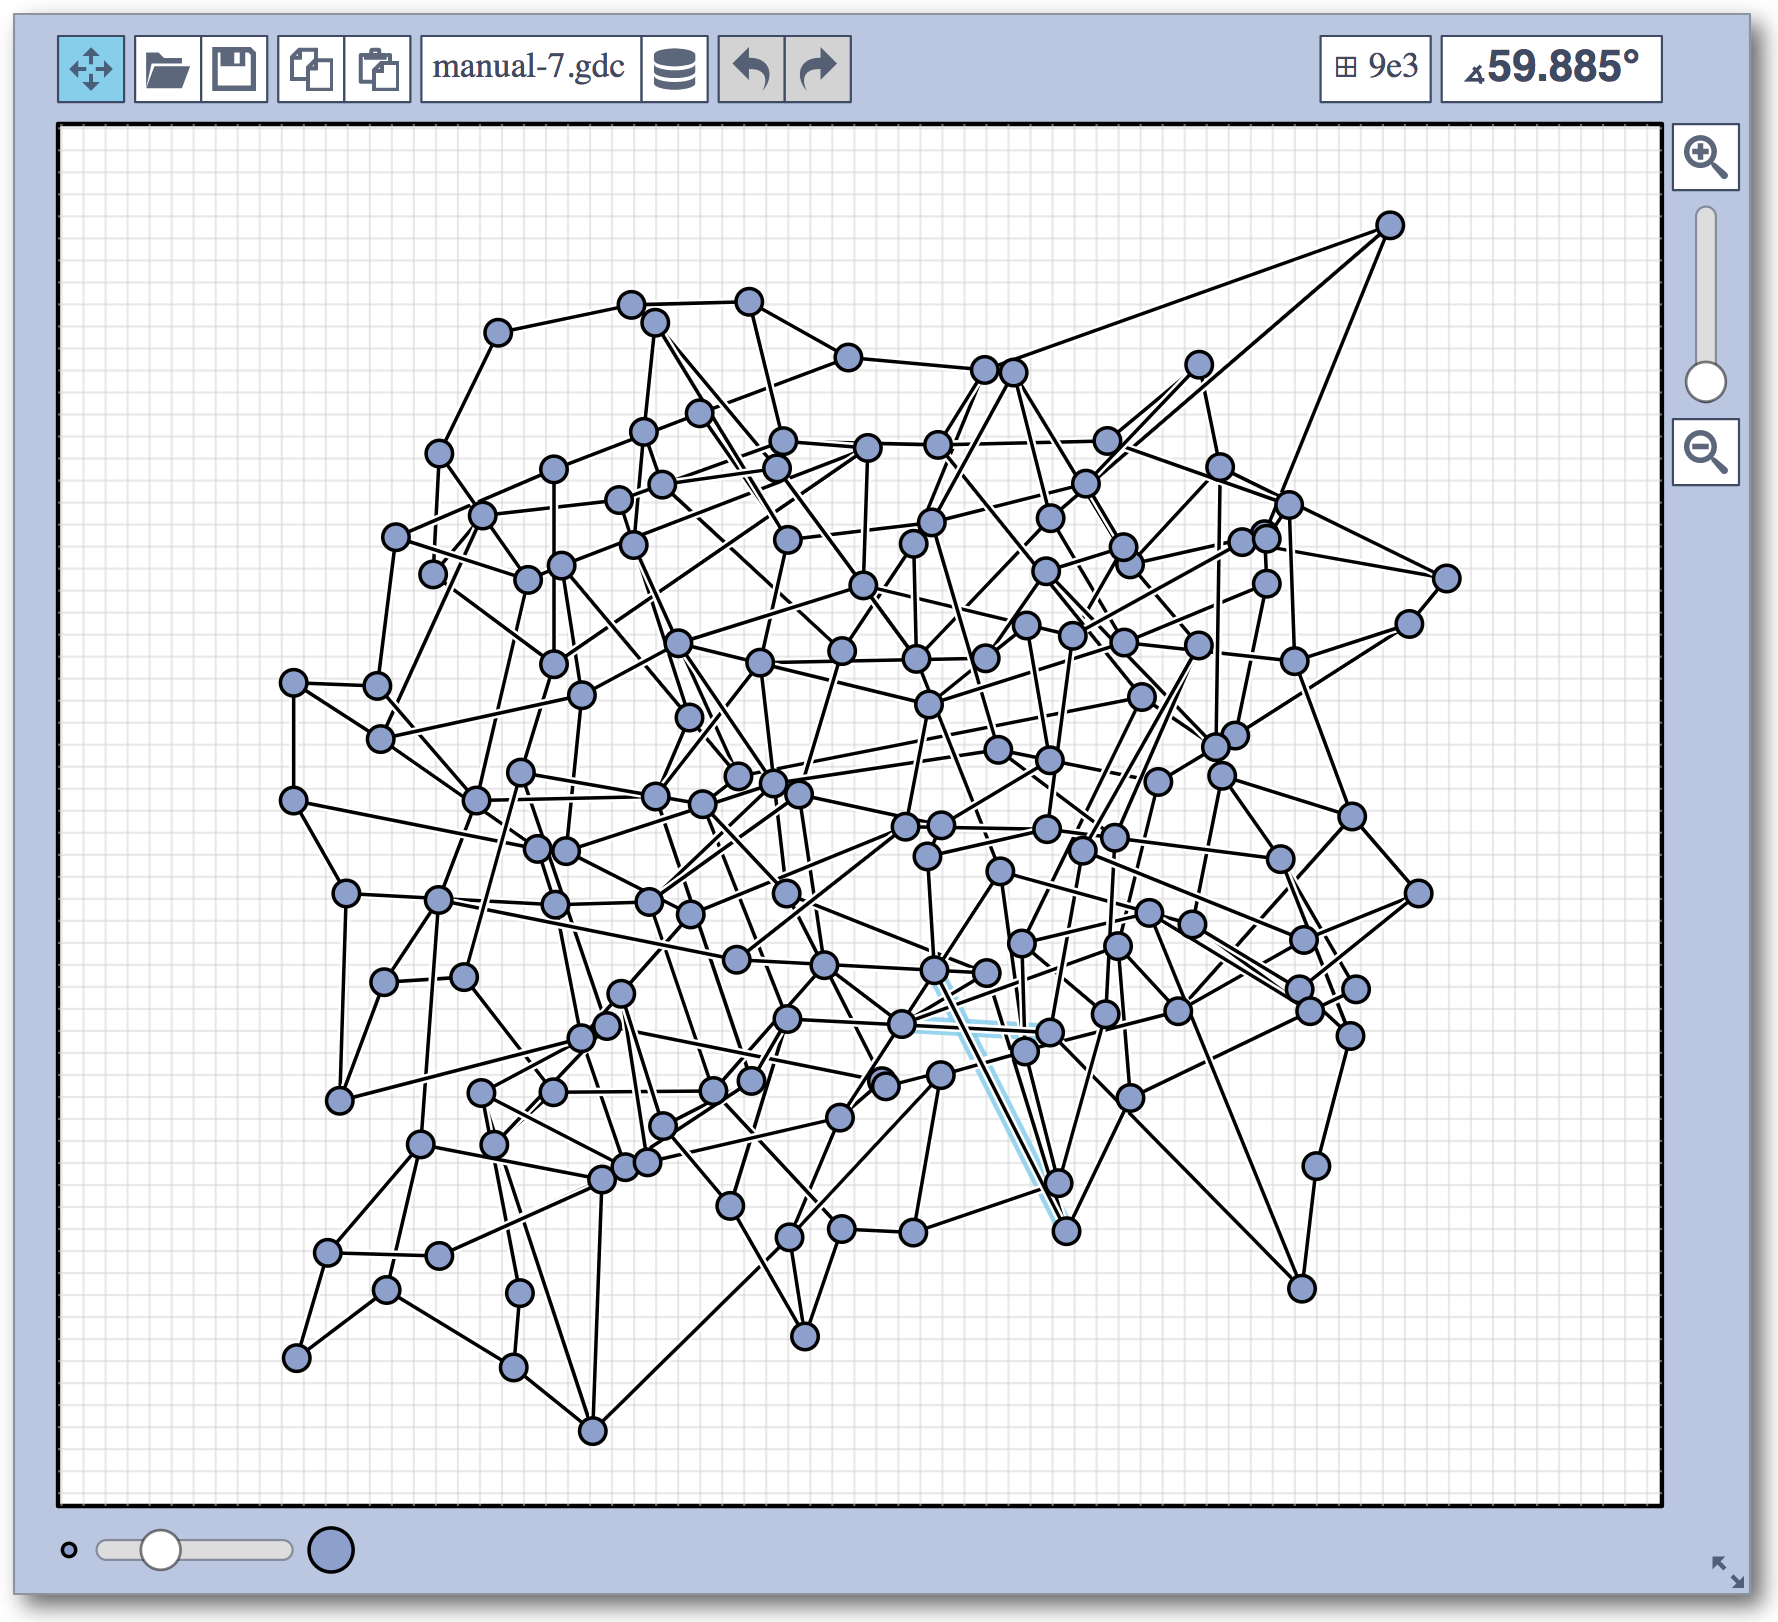
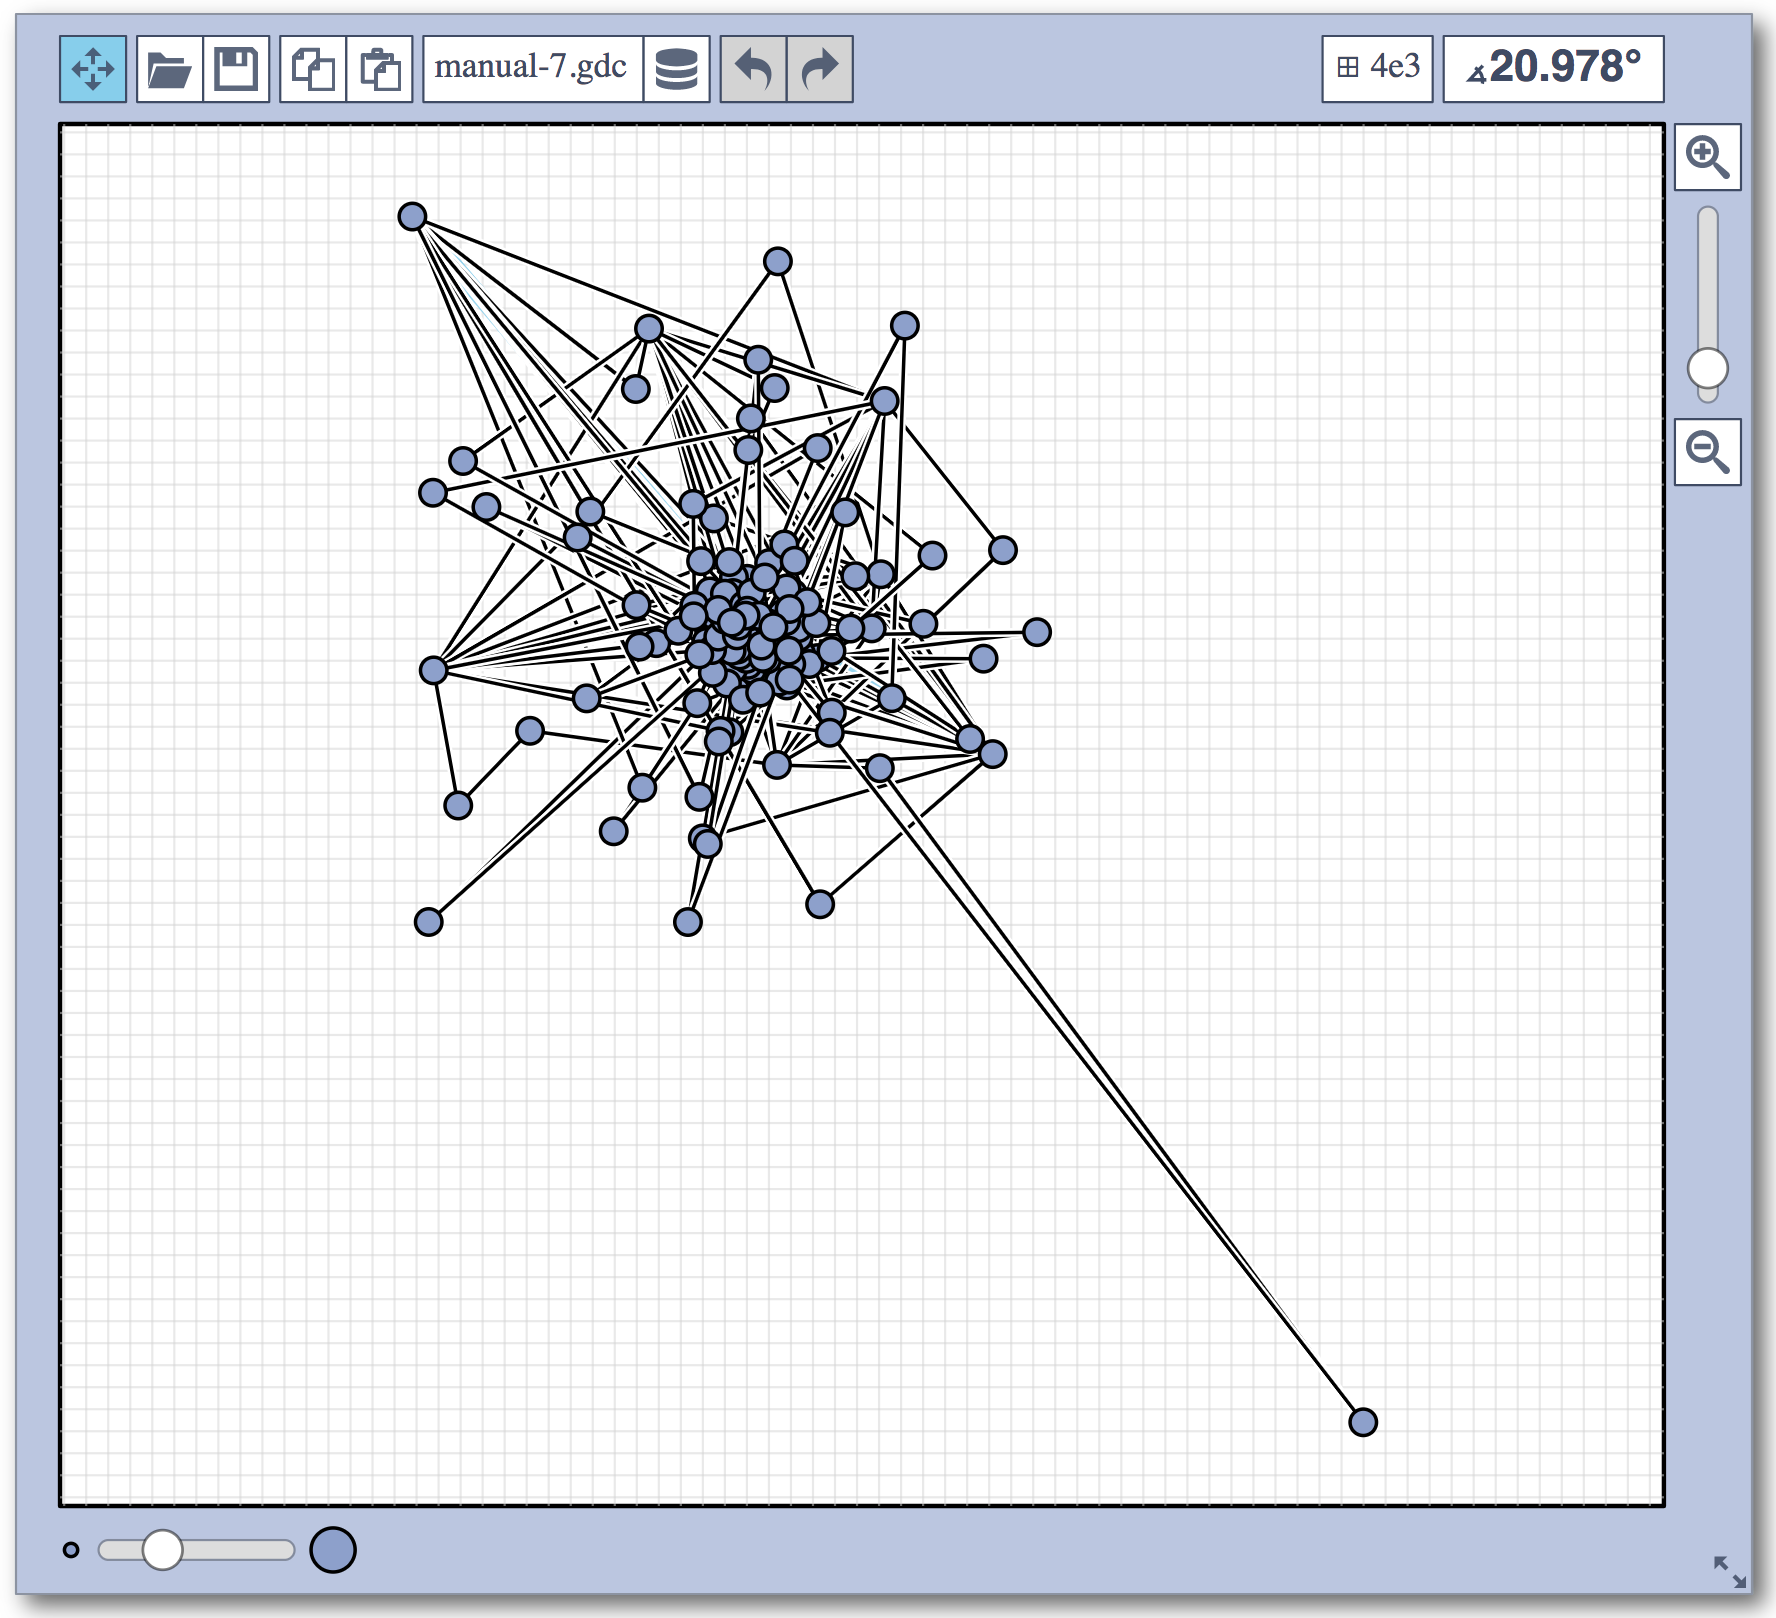
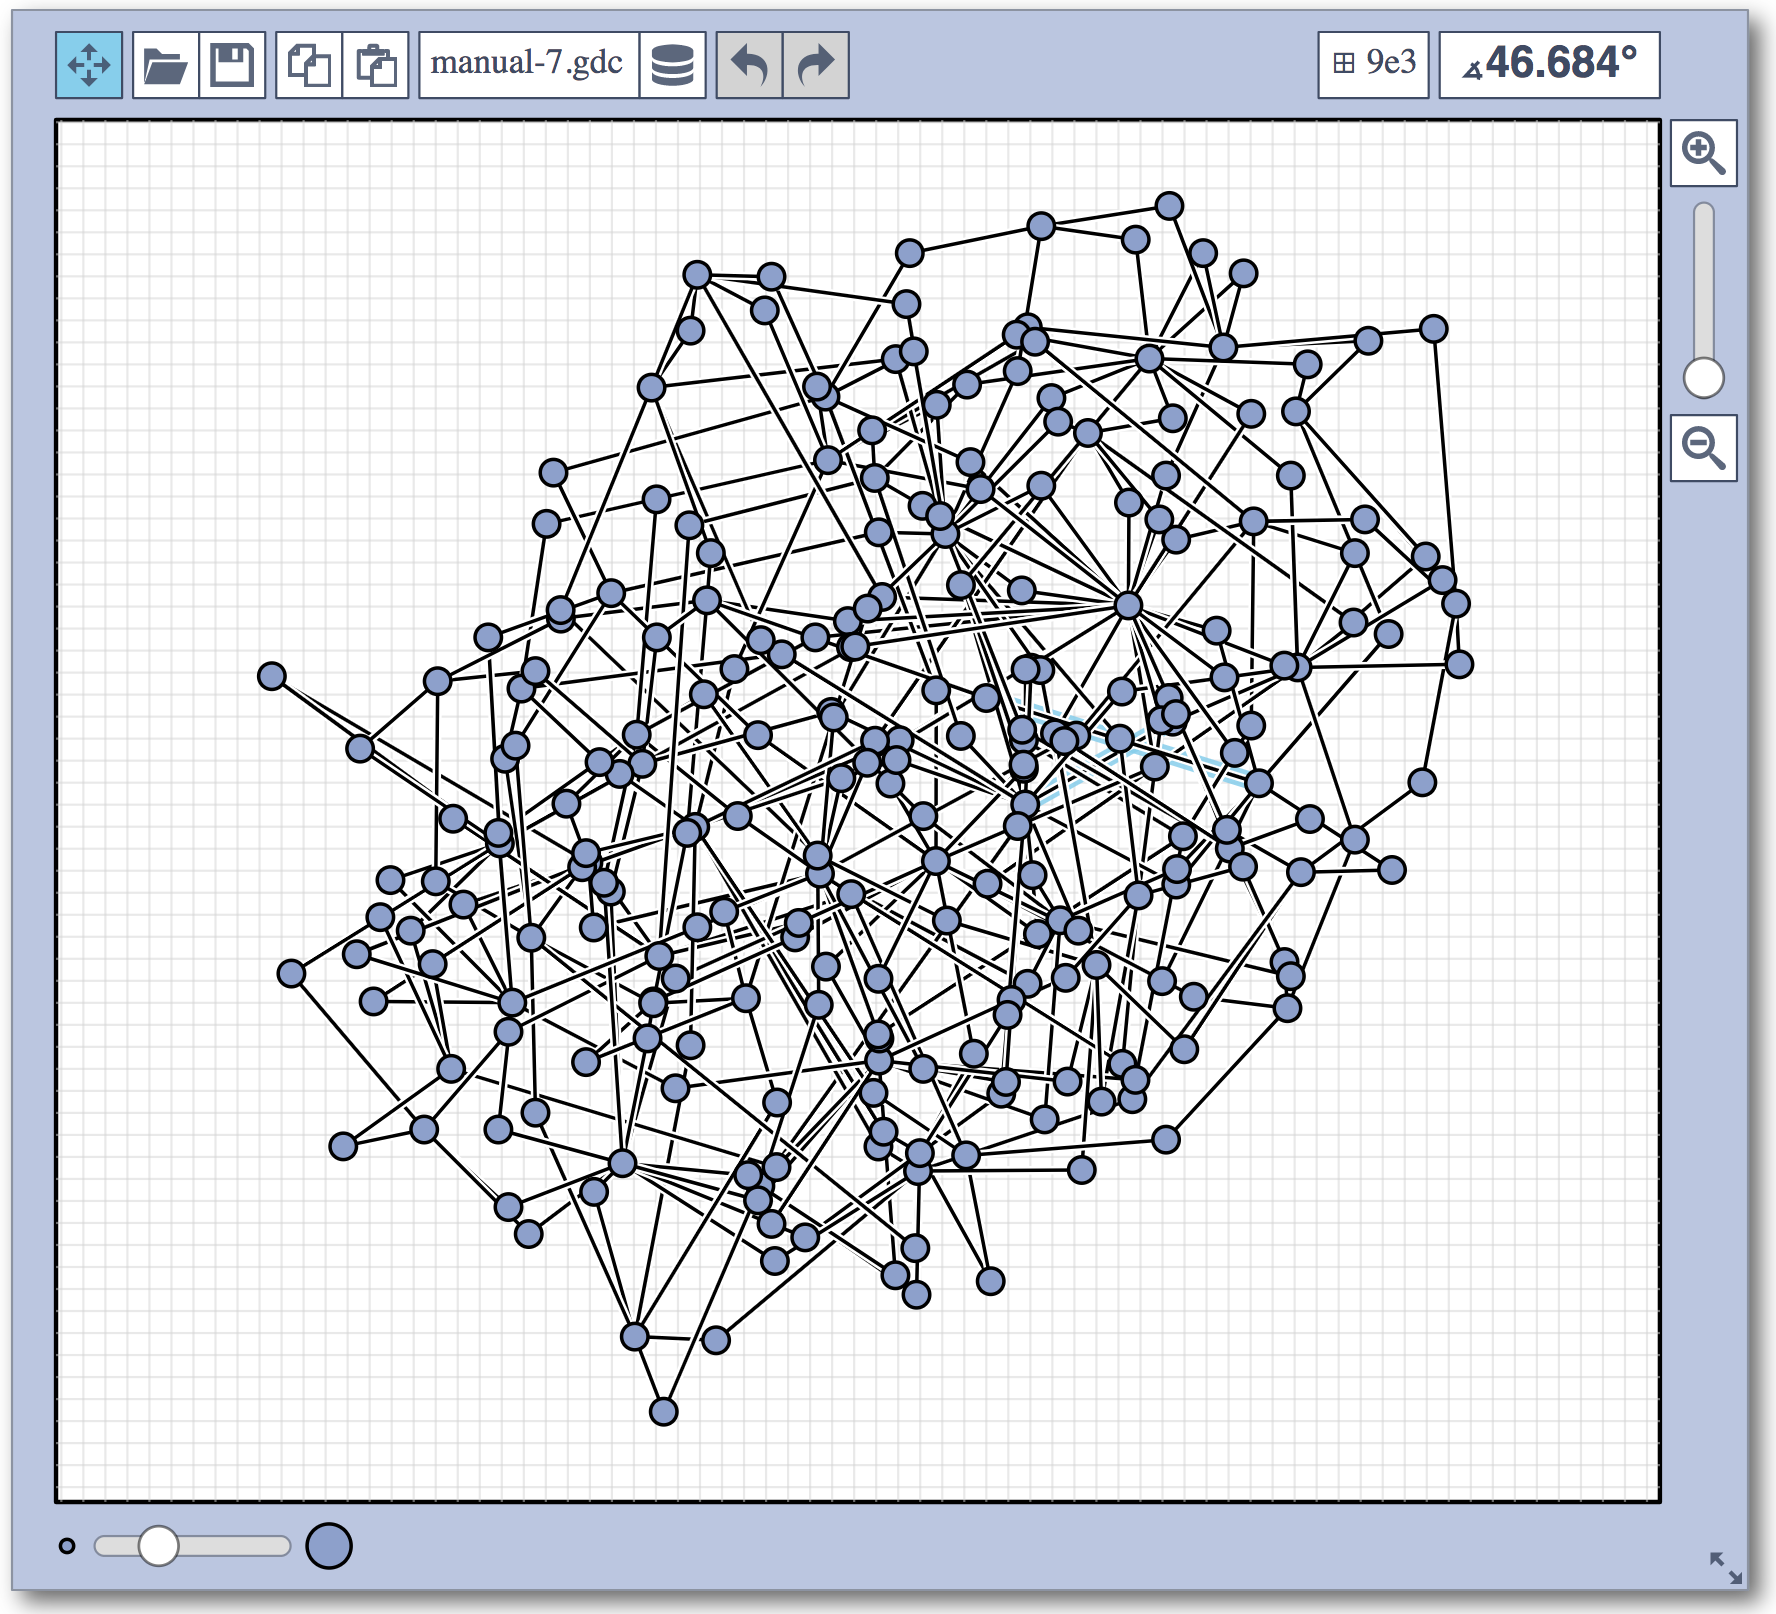
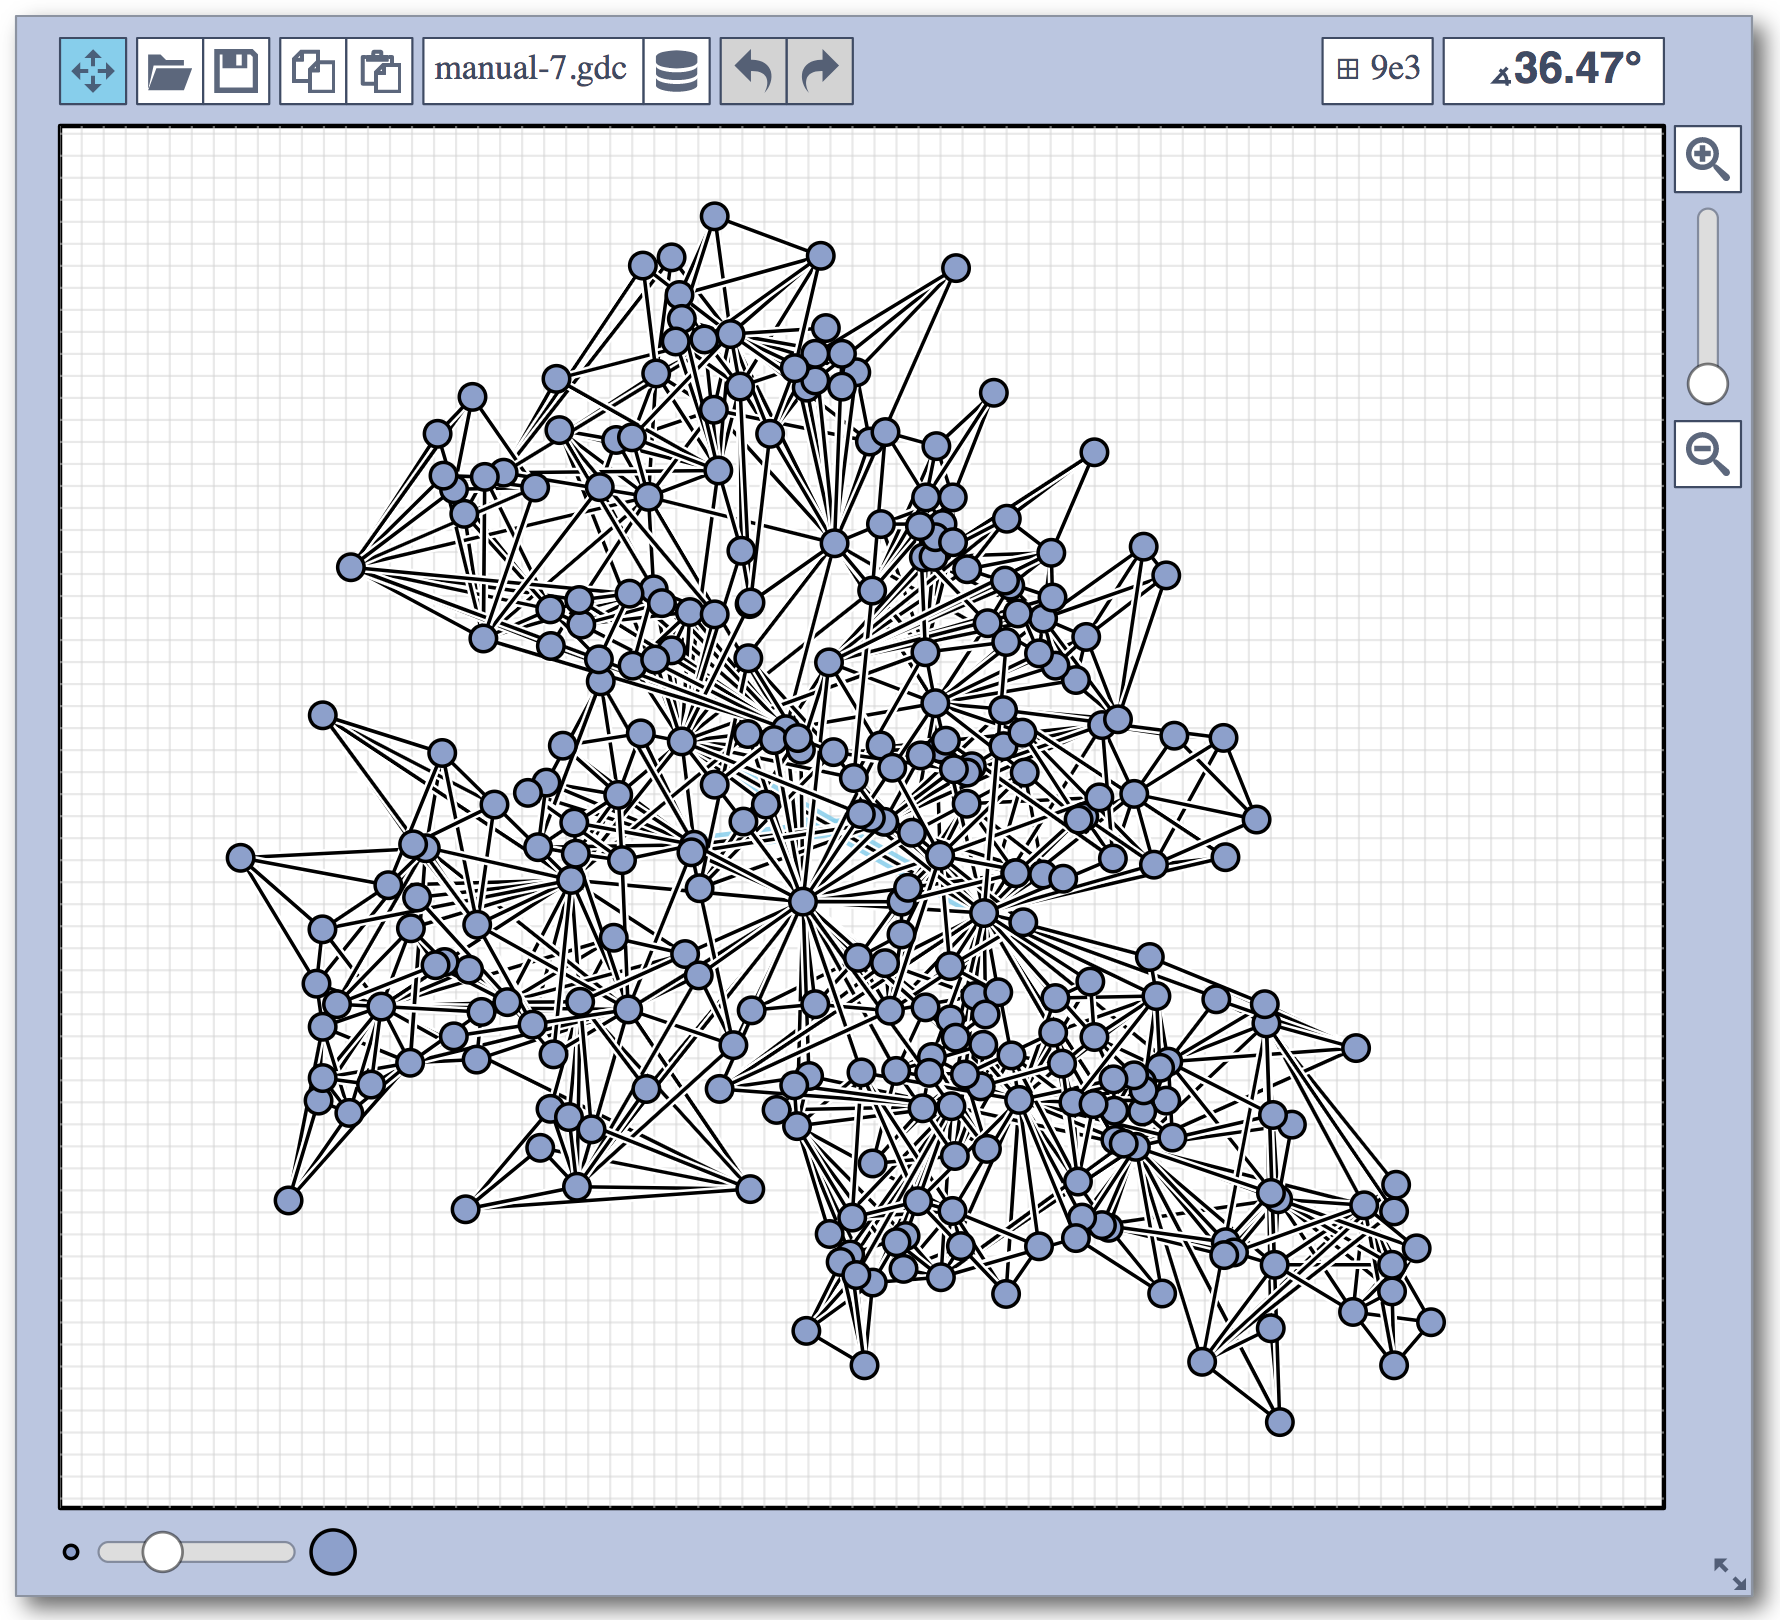
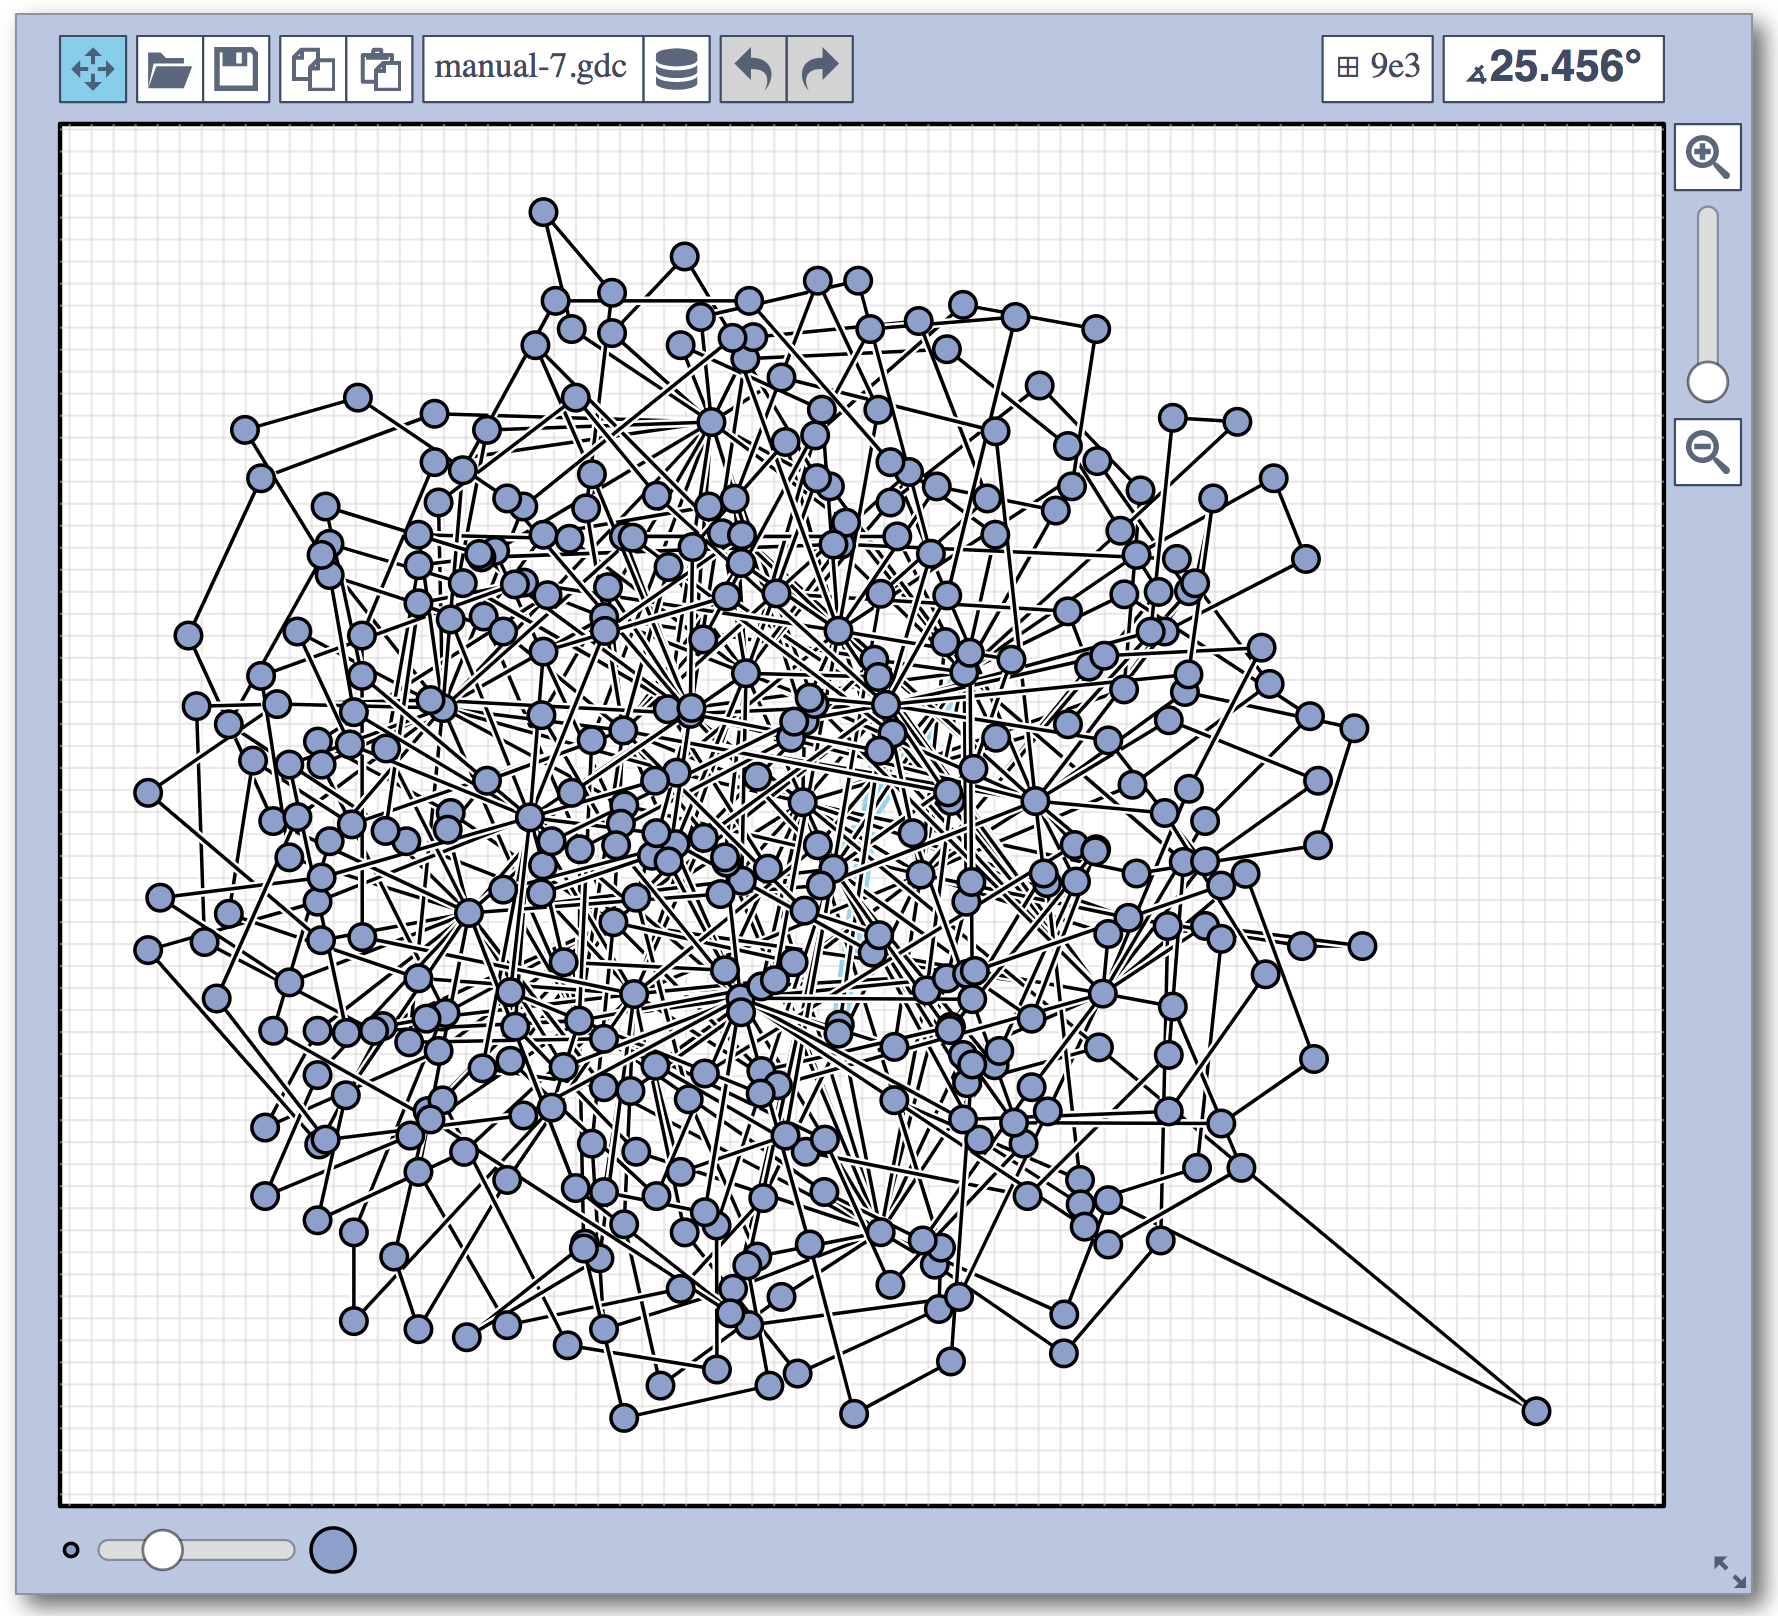
problem 7: input
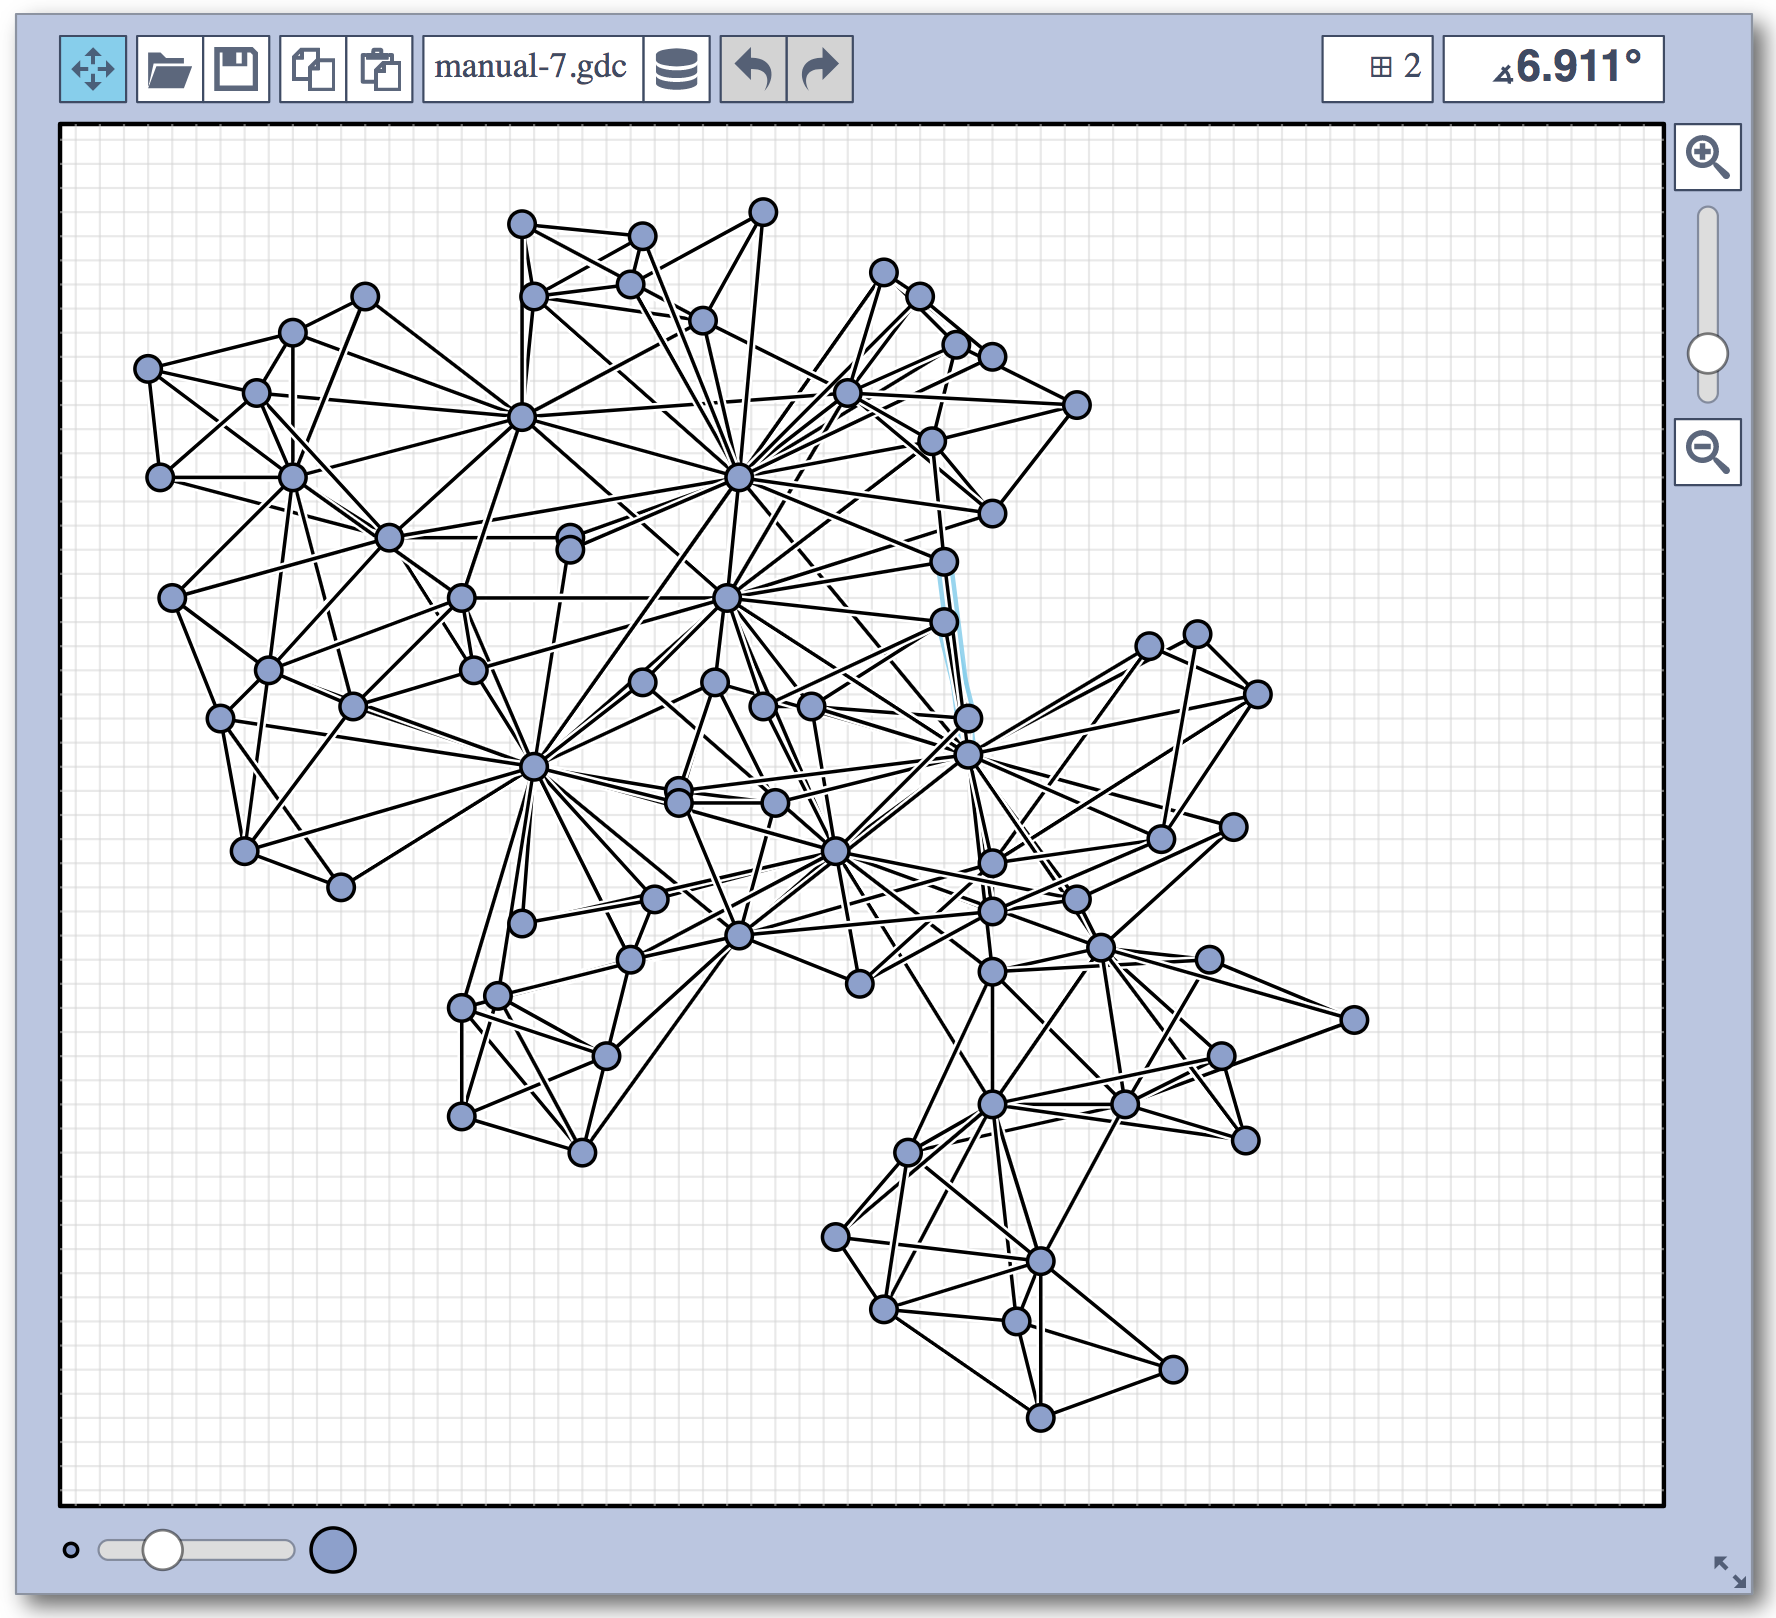
|
problem 7: best manual submission
|
We are happy to present the full list of scores for all teams. The numbers listed are the smallest crossing angle in degrees in each graph; the horizontal bars visualize the corresponding scores.
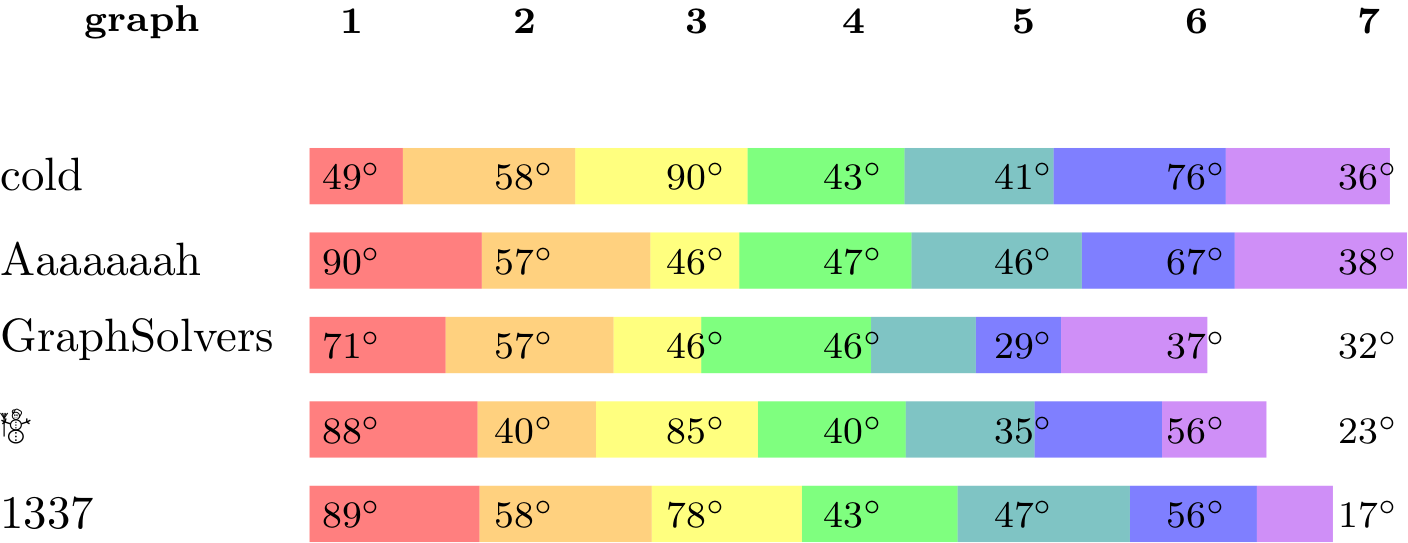
The winning team is team Aaaaaaah, consisting of Theresa Fr&oulm;schl, Jonathan Klawitter, and Darren Strash!
Jonathan Klawitter: We entered the contest in a state of total panic and excitement (see team name). Without any conscious strategy we tackled graph after graph, often removing one bad angle at a time. To comfort ourselves with the (false) belief that we actually had a strategy, we also tried simple global optimizations: bundling non-crossing edges in parallel, shrinking planar subgraphs so edges would not cross them, and moving badly-behaving vertices far away from the others (who knows, they might be contagious). Constantly in fear of destroying our progress with just the next step, which happened often, we celebrated each minor improvement with a save and a submission of our current best solution.
Live Challenge: Automatic Category
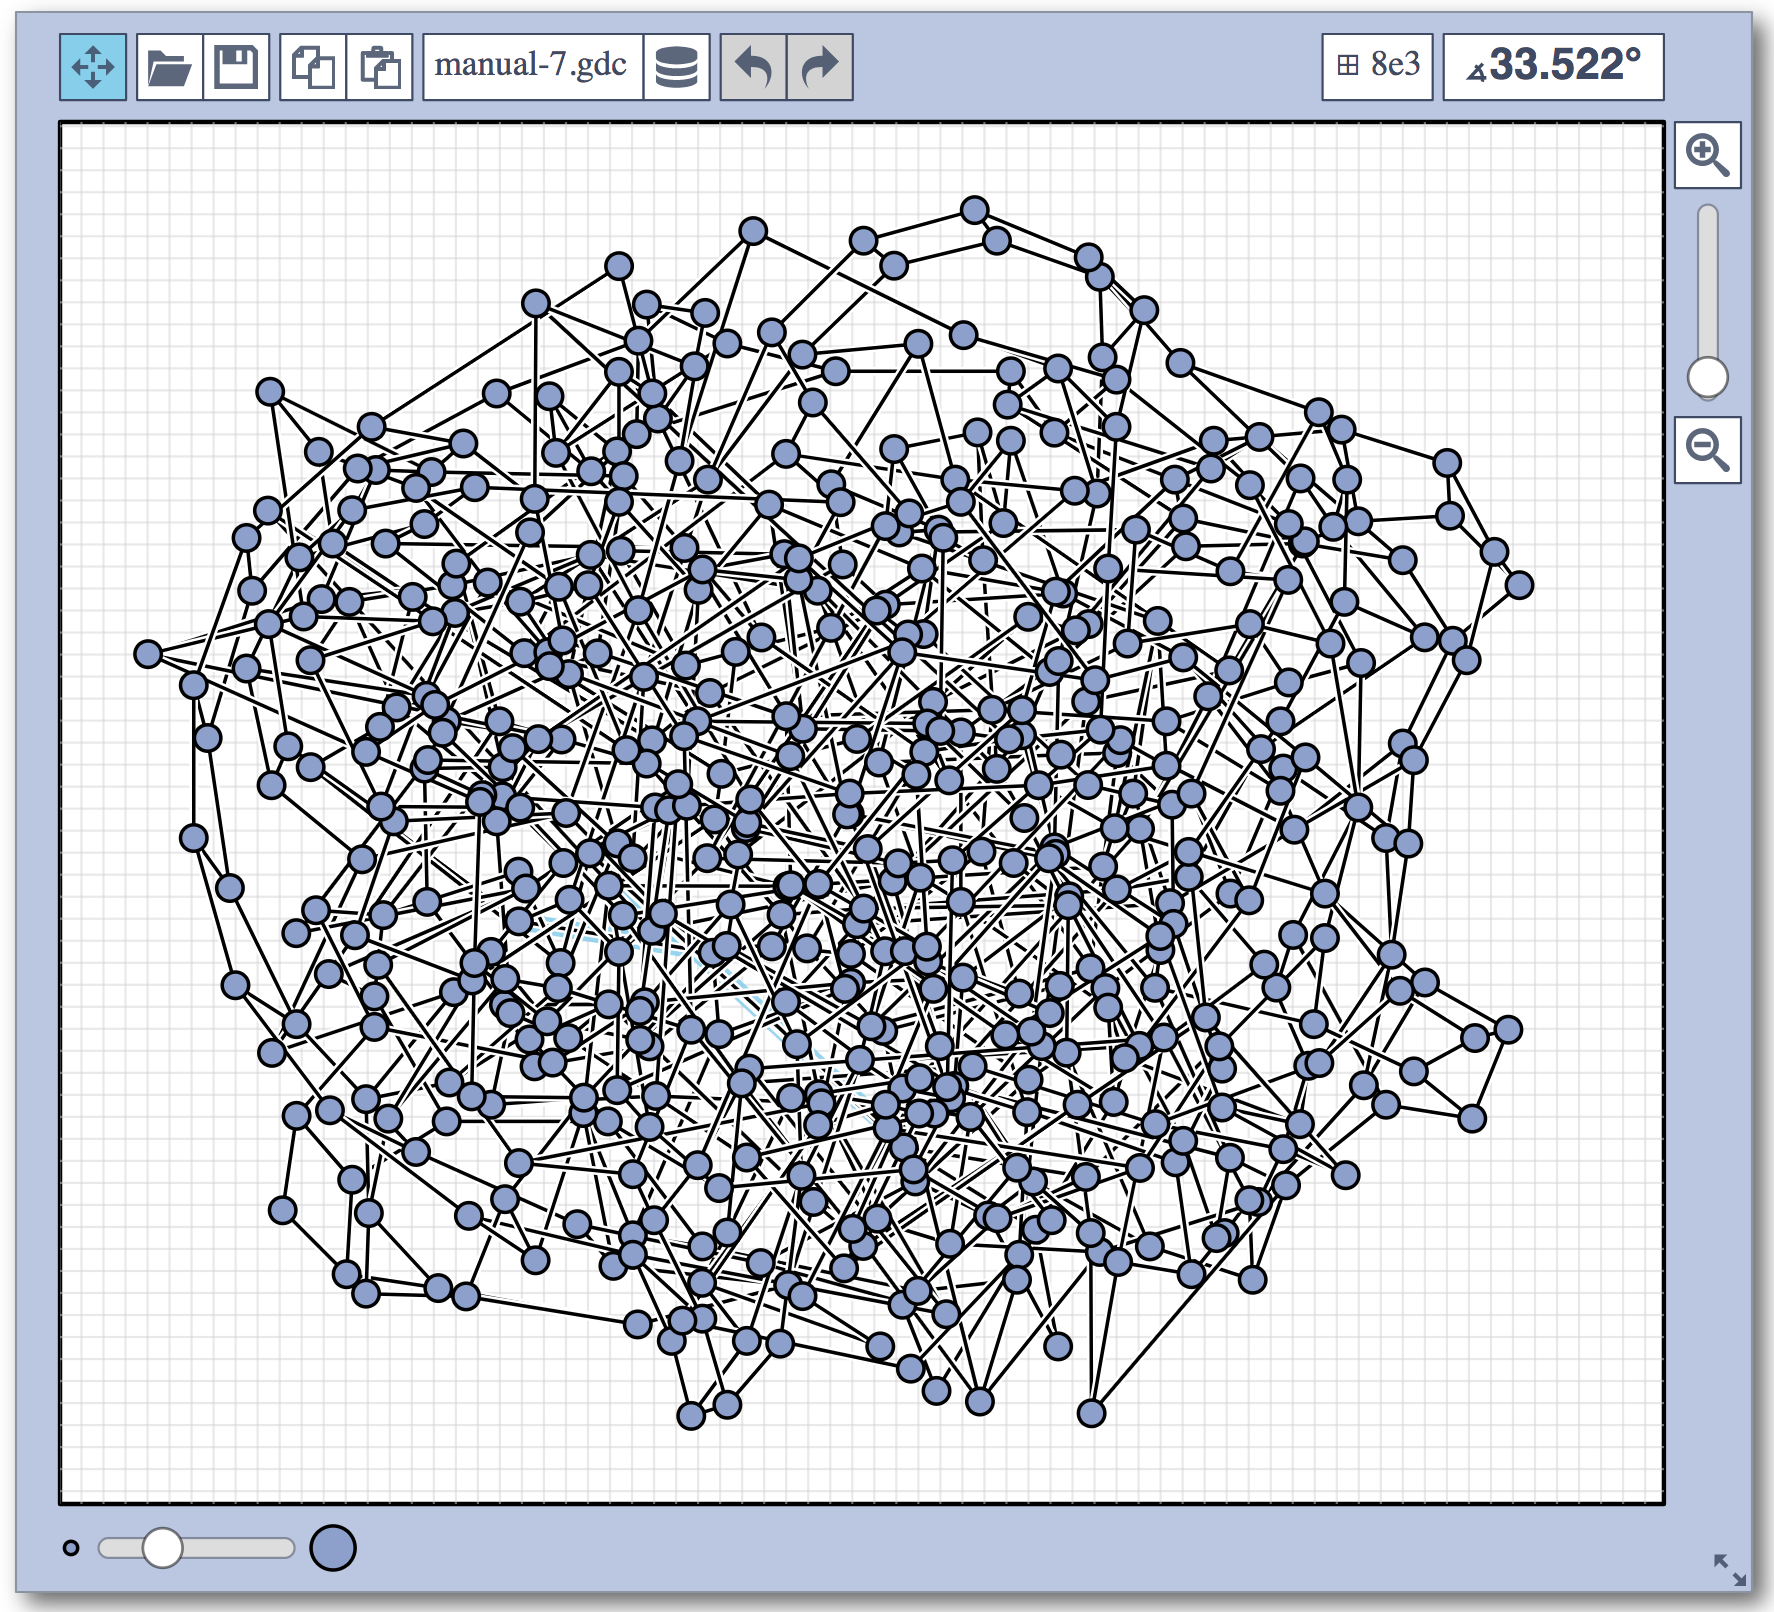
In the automatic category, the same seven graphs as in the manual category had to be solved, and in addition another set of nine larger graphs.
problem 1: best automatic submission
|
problem 2: best automatic submission
|
problem 3: best automatic submission
|
problem 4: best automatic submission
|
problem 5: best automatic submission
|
problem 6: best automatic submission
|
problem 7: best automatic submission
|
problem 8: best automatic submission
|
problem 9: best automatic submission
|
problem 10: best automatic submission
|
problem 11: best automatic submission
|
problem 12: best automatic submission
|
problem 13: best automatic submission
|
problem 14: best automatic submission
|
problem 15: best automatic submission
|
problem 16: best automatic submission
|
Again, we are happy to present the full list of scores for all teams. The numbers listed are the number of crossings in each graph; the horizontal bars visualize the corresponding scores.
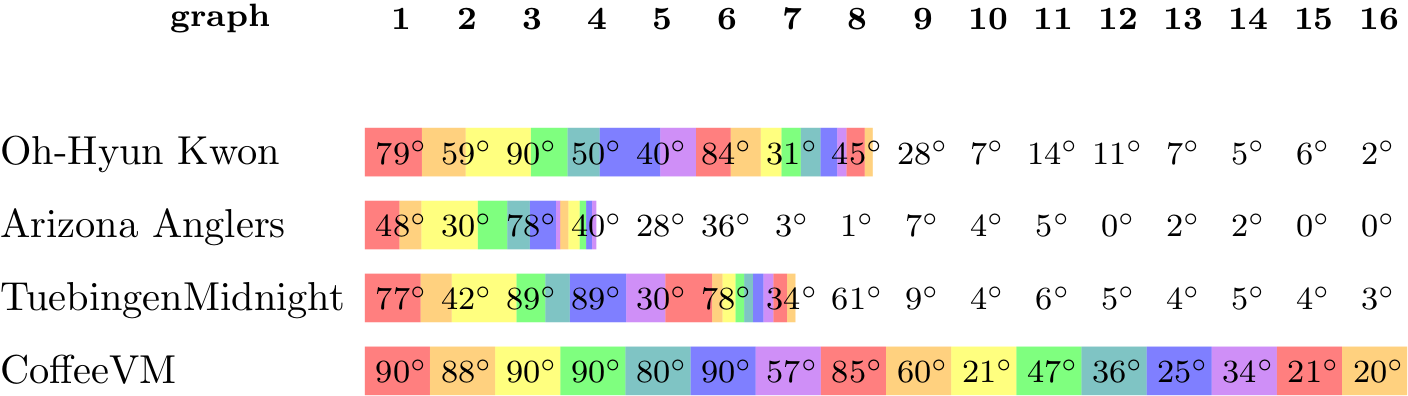
The winning team is team team CoffeeVM, consisting of Almut Demel, Dominik Dürrschnabel, Tamara Mchedlidze, Marcel Radermacher and Lasse Wulf!
Lasse Wulf: We use a two-step procedure. In the first step we apply energy-based approach modified to increase the crossing angles. In the second step we improve the result by a local search procedure. For larger graphs, we apply a heuristic to speed up the calculations of the crossing angles.