Topics
We have two creative topics, that are judged independently:
- Graph Drawing Citations: This graph models citations between graph drawing papers in the last 25 years.
- Human Metabolism: This graph is the largest manually drawn hypergraph in biology and describes chemical transformations within human cells.
Participants may submit drawings of both graphs (or only one graph).
Graph Drawing Citations
For the first creative topic, we extracted data of all publications in the Proceedings of Graph Drawing between 1994 and 2015. For each paper, we provide the title, the authors, the institutions of the authors, the year, and the citations. Your task is to create a nice visualization of the given citation network. It is desirable but not compulsory to make use of the extra data (authors, institutions, years) or a subset of it to explore interesting structures in the network.
The graph is provided in XML format with the following tags for each paper:
| <id> | The DOI of the paper used as primary key. |
| <title> | The title of the paper. |
| <author> | An author of the paper; one tag per author. |
| <institution> | The institution of an author at the time of publication; one tag per institution. |
| <cites> | The <id> of another GD paper that this paper cites; one tag per citation. |
| <citedby> | The <id> of another GD paper that cites this paper; one tag per citation. |
| <year> | The year of the publication. |
The graph is available here.
Human Metabolism
Recon 2 is a a community-driven, consensus 'metabolic reconstruction', which is the most comprehensive representation of human metabolism that is applicable to computational modeling. It was published by Thiele et al. in Nature Biotechnology 31, 419–425 (2013). Recon 2 can be used to identify causes of and new treatments for diseses like cancer, diabetes and even psychiatric and neurodegenerative disorders. Each person's metabolism, which represents the conversion of food sources into energy and the assembly of molecules, is determined by genetics, environment and nutrition. Metabolic imbalances is an underlying cause of disease. Recon 2 merges complex details into a single interactive map and allows researchers to use this existing gene expression data and knowledge of the entire metabolic network to, for example, figure out how certain drugs would affect specific metabolic pathways found to create the conditions for cancerous cell growth.
ReconMap 2.0 is an interactive visualization of Recon 2 by Noronha et al. The map was drawn manually by 5 undergraduate biochemists over a total of 20 months and is, to the best of our knowledge, the largest manually drawn hypergraph in biology. A Constraint-Based Reconstruction and Analysis (COBRA) Toolbox extension to interact with ReconMap is available at OpenCOBRA (GitHub). There are 7440 metabolite reactions (hyperedges) and 5063 metabolite (nodes). The article describing the map is available here.
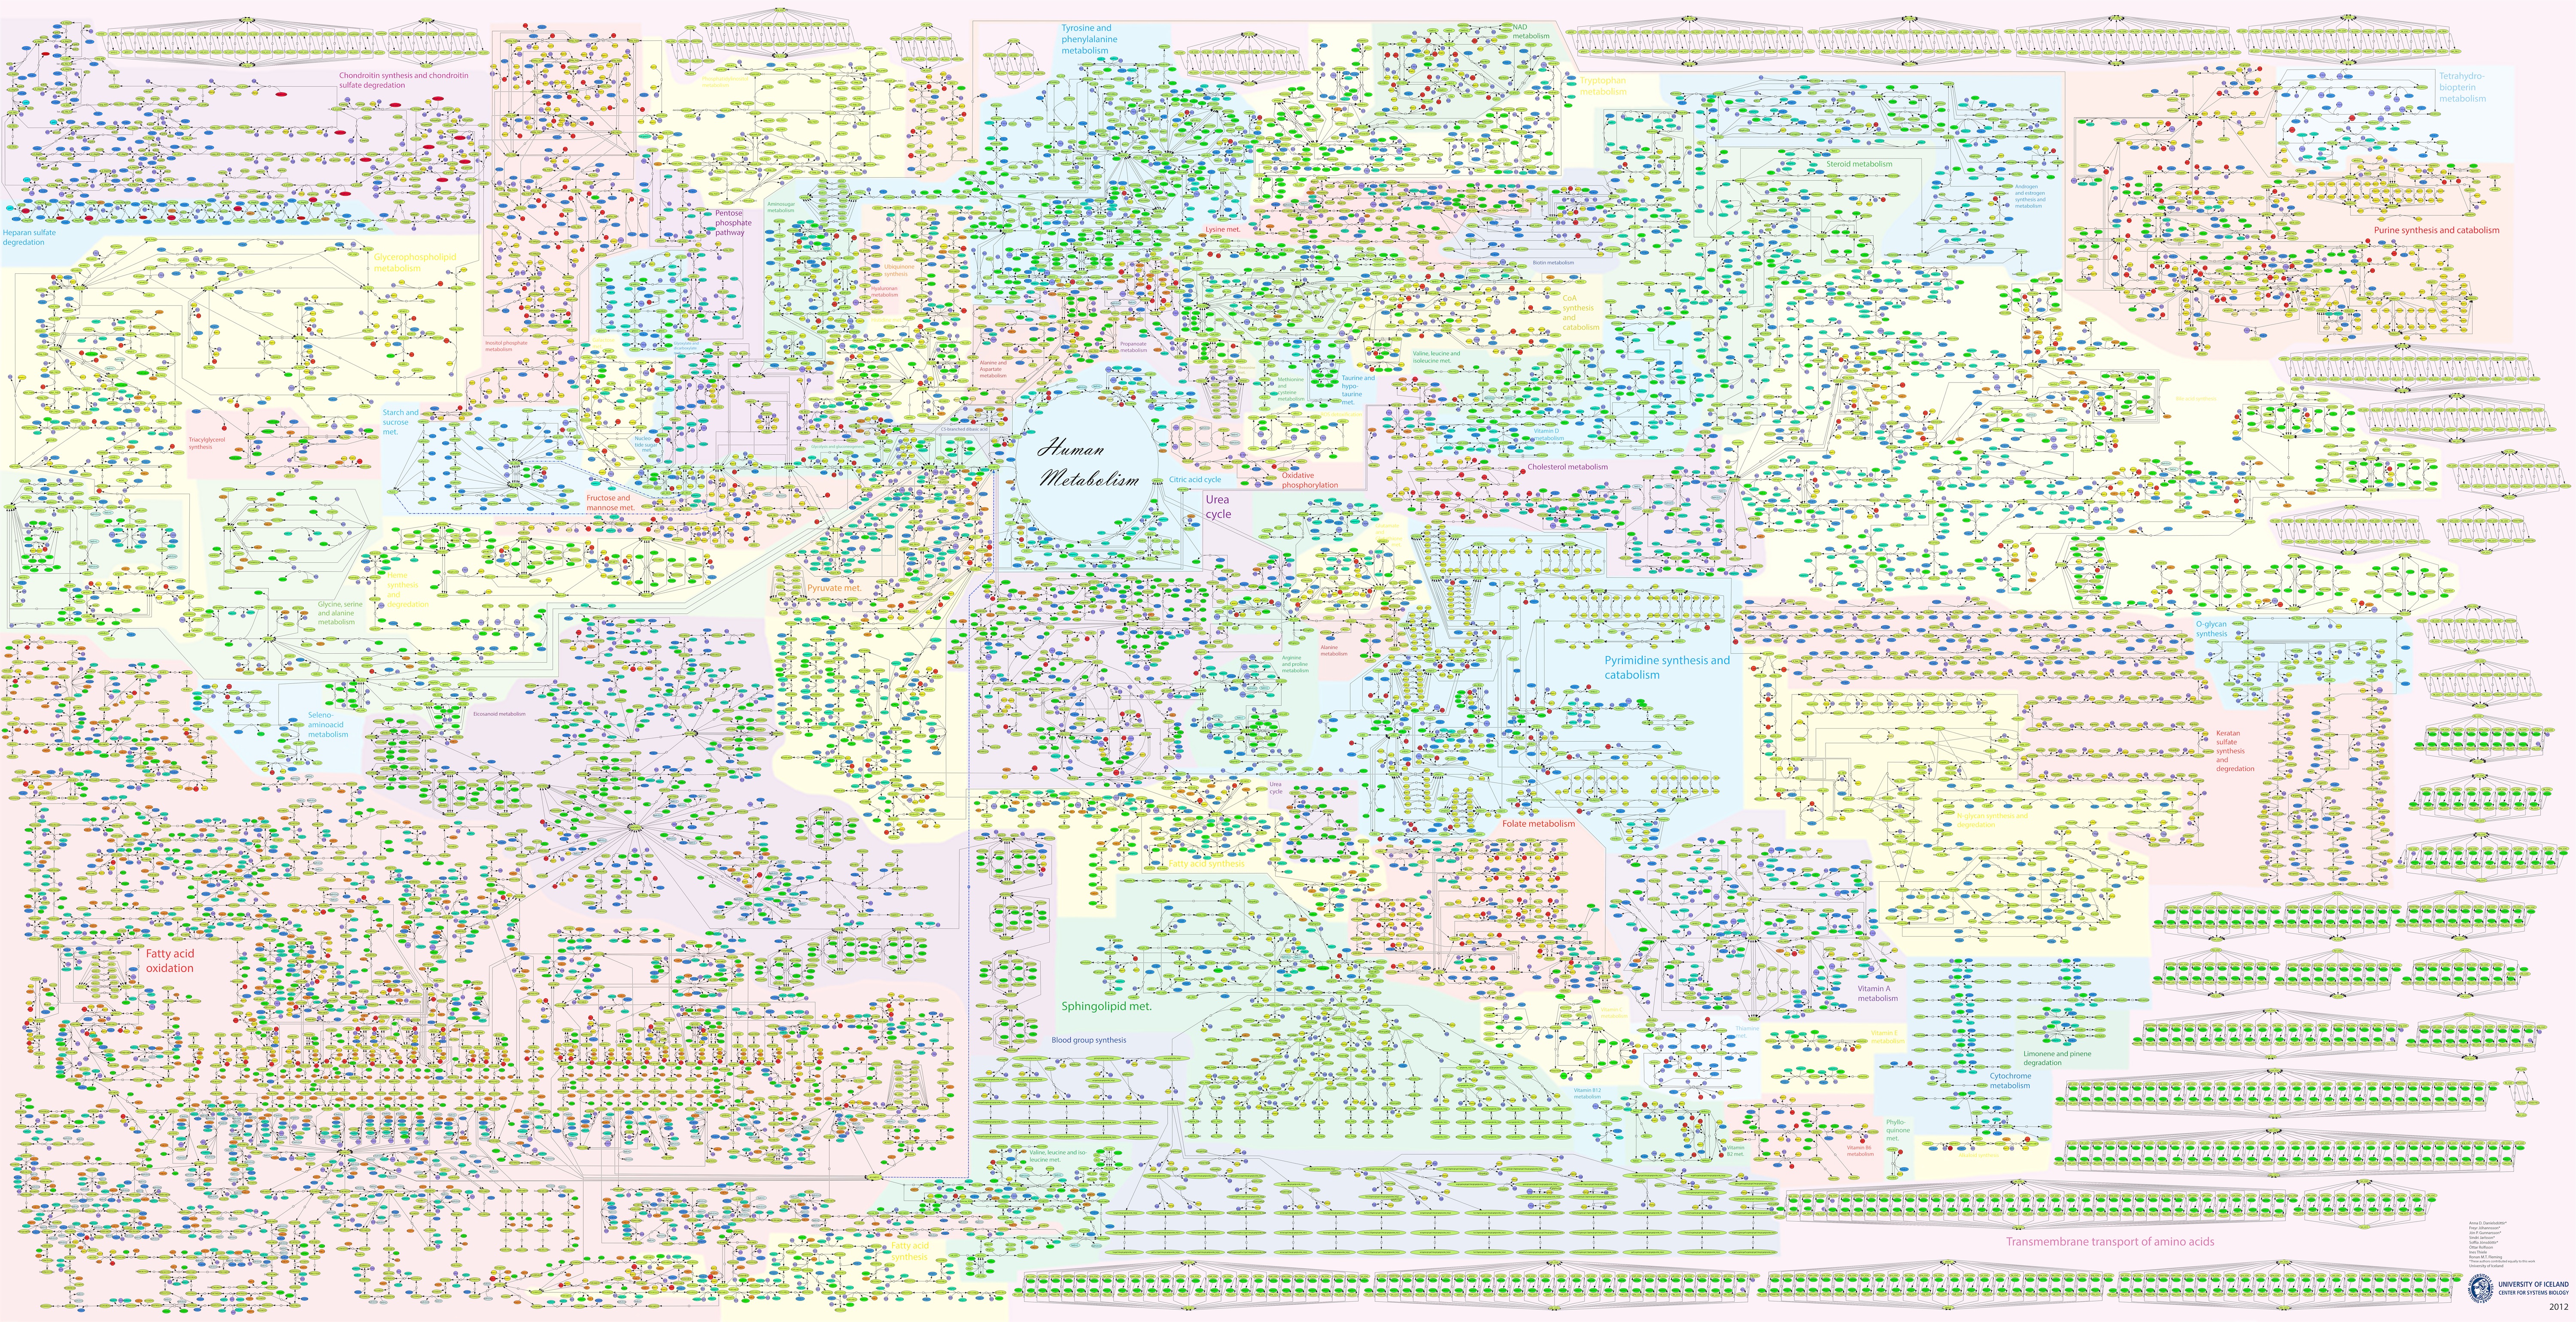
Image detail of ReconMap 2.0. Click for a large version.
Your task is to create an alternative visualization of Recon 2 using existing or your own graph drawing algorithms.
The graph is provided in the GraphML File Format. We represented the hypergraph as a bipartite graph where each metabolite and each reaction (hyperedge in the original graph) is represented by a node. The reaction-nodes are connected to the metabolites occuring in the corresponding reaction by edges of the type reactant (if the corresponding metabolite is on the left side of the equation) or product (if the corresponding metabolite is on the right side of the equation). The type of the nodes and edges is stored in the <desc> tag. For the nodes, the following additional information exists.
- metabolite: This node represents a metabolite in the dataset and contains two data keys.
- formula: The elemental formula for the metabolite.
- name: The full name of the metabolite.
- reaction: This node represents a reaction between metabolites and contains three data keys.
- formula: The elemental formula for the reaction.
- subsystem: The subsystem assignment of the reaction; each subsystem represents a clustering of reactions.
- name: The full name of the reaction.
Note that a reaction can be reversible (e.g., h2o[r] <-> h[r] + pi[r]) or irreversible (e.g., acnam[c] -> pyr[c] + acmana[c]). In the reversible case, the reaction can be done in both directions, and we use undirected edges between the metabolites and the reaction. In the irreversible case, the reaction can only be done in one direction, and we use directed edges from the reactants to the reaction and from the reaction to the products. Note that one or even both sides of the reaction may be empty.
The graph is available here. The underlying data can also be found in this XML file. The drawing of the graph is available as an SBML file for the software CellDesigner. You can find this file here.
Evaluation
For the creative topics, you are completely free to use any drawing style you wish. Your submissions will be judged both on aesthetic value and on the clarity of information displayed.
Submission
Electronic submissions (by email) must be received by September 15 (23:59 CEST) and must include the following information:
- Names and email addresses of the contributors.
- A visualization illustrating the graph in a format of your choosing.
- A brief description on how the graph and layout were produced.
- A web-friendly image of your visualization. Max resolution 1000 by 1000 pixels.
- A pdf version of your visualization, suitable for printing on a large A0 poster.
If your drawing requires special printing because of size, resolution, or color constraints, you are encouraged to submit via hard-copy. In this case, please contact us in advance and make sure that your submission is received no later than September 15. Please still submit the remaining items by email.
Please send your contest submissions to:
Maarten Löffler
PO Box 80.089
3508 TB Utrecht
The Netherlands