Contest 2023: Creative Topic
Creative Topic
This year, there is a single creative topic: Board-Game Recommendations. Each participant may submit one drawing of this graph for evaluation.
Board-Game Recommendations
The dataset contains the top-100 games found on BoardGameGeek. In the dataset every board game forms a vertex. Two games are connected via a directed edge if the players of the one game also like the other game. We extracted this data from the “Fans Also Like” data on BoardGameGeek (see for example here for the game Gloomhaven). Additionally each game comes with a set of metadata. This data contains fields like the year the game was released or the min- and max-age of the players. Below we show an example entry of a JSON record of one game. The fields are present for every game in the top 100. The data file contains the games as JSON records in an array. Each game also comes with an ID as well as an entry “recommendations”/”fans_liked” which contains a list of the IDs of the games that players of this games liked.
Click to expand the sample json entry
{
    "id": 173346, // ID of the game on BoardGameGeek
    "title": "7 Wonders Duel", // Title of the game
    "year": 2015, // Year of publication
    "rank": 19, // Rank on BoardGameGeek
    "minplayers": 2, // Min and max number of players
    "maxplayers": 2,
    "minplaytime": 30, // Min and max minutes of playtime
    "maxplaytime": 30,
    "minage": 10, // Min age to play
    "rating": {
        "rating": 8.0984, // Rating on BoardGameGeek
        "num_of_reviews": 80420 // Number of reviews on BoardGameGeek
    },
    "recommendations": {
        "fans_liked": [ // List of game ids in the top 100
            148228,     // that fans of this game also liked
            70919,
            233867,
            84876,
            230802,
            209685,
            54043,
            118048,
            312484,
            244521,
            157354,
            284083,
            132531,
            262712,
            108745,
            266192,
            201808,
            155987,
            163412,
            30549,
            98778,
            271324,
            194655,
            68448,
            183394,
            263918,
            167791,
            199792
        ]
    },
    "types": {
        "categories": [ // List of categories this game falls into
            {
                "id": 1050, // ID of a category on BoardGameGeek
                "name": "Ancient" // Name of the category
            },
            {
                "id": 1002,
                "name": "Card Game"
            },
            {
                "id": 1029,
                "name": "City Building"
            },
            {
                "id": 1015,
                "name": "Civilization"
            },
            {
                "id": 1021,
                "name": "Economic"
            }
        ],
        "mechanics": [ // List of mechanics this game uses
            {
                "id": 3001, // ID of the mechanic on BoardGameGeek
                "name": "Layering" // Name of the mechanic
            },
            {
                "id": 2041,
                "name": "Open Drafting"
            },
            {
                "id": 2004,
                "name": "Set Collection"
            },
            {
                "id": 2884,
                "name": "Sudden Death Ending"
            },
            {
                "id": 2888,
                "name": "Tug of War"
            },
            {
                "id": 2015,
                "name": "Variable Player Powers"
            }
        ]
    },
    "credit": {
        "designer": [ // List of the game designers
            {
                "id": 9714, // ID of the designer on BoardGameGeek
                "name": "Antoine Bauza" // Name of the designer
            },
            {
                "id": 1727,
                "name": "Bruno Cathala"
            }
        ]
    }
}
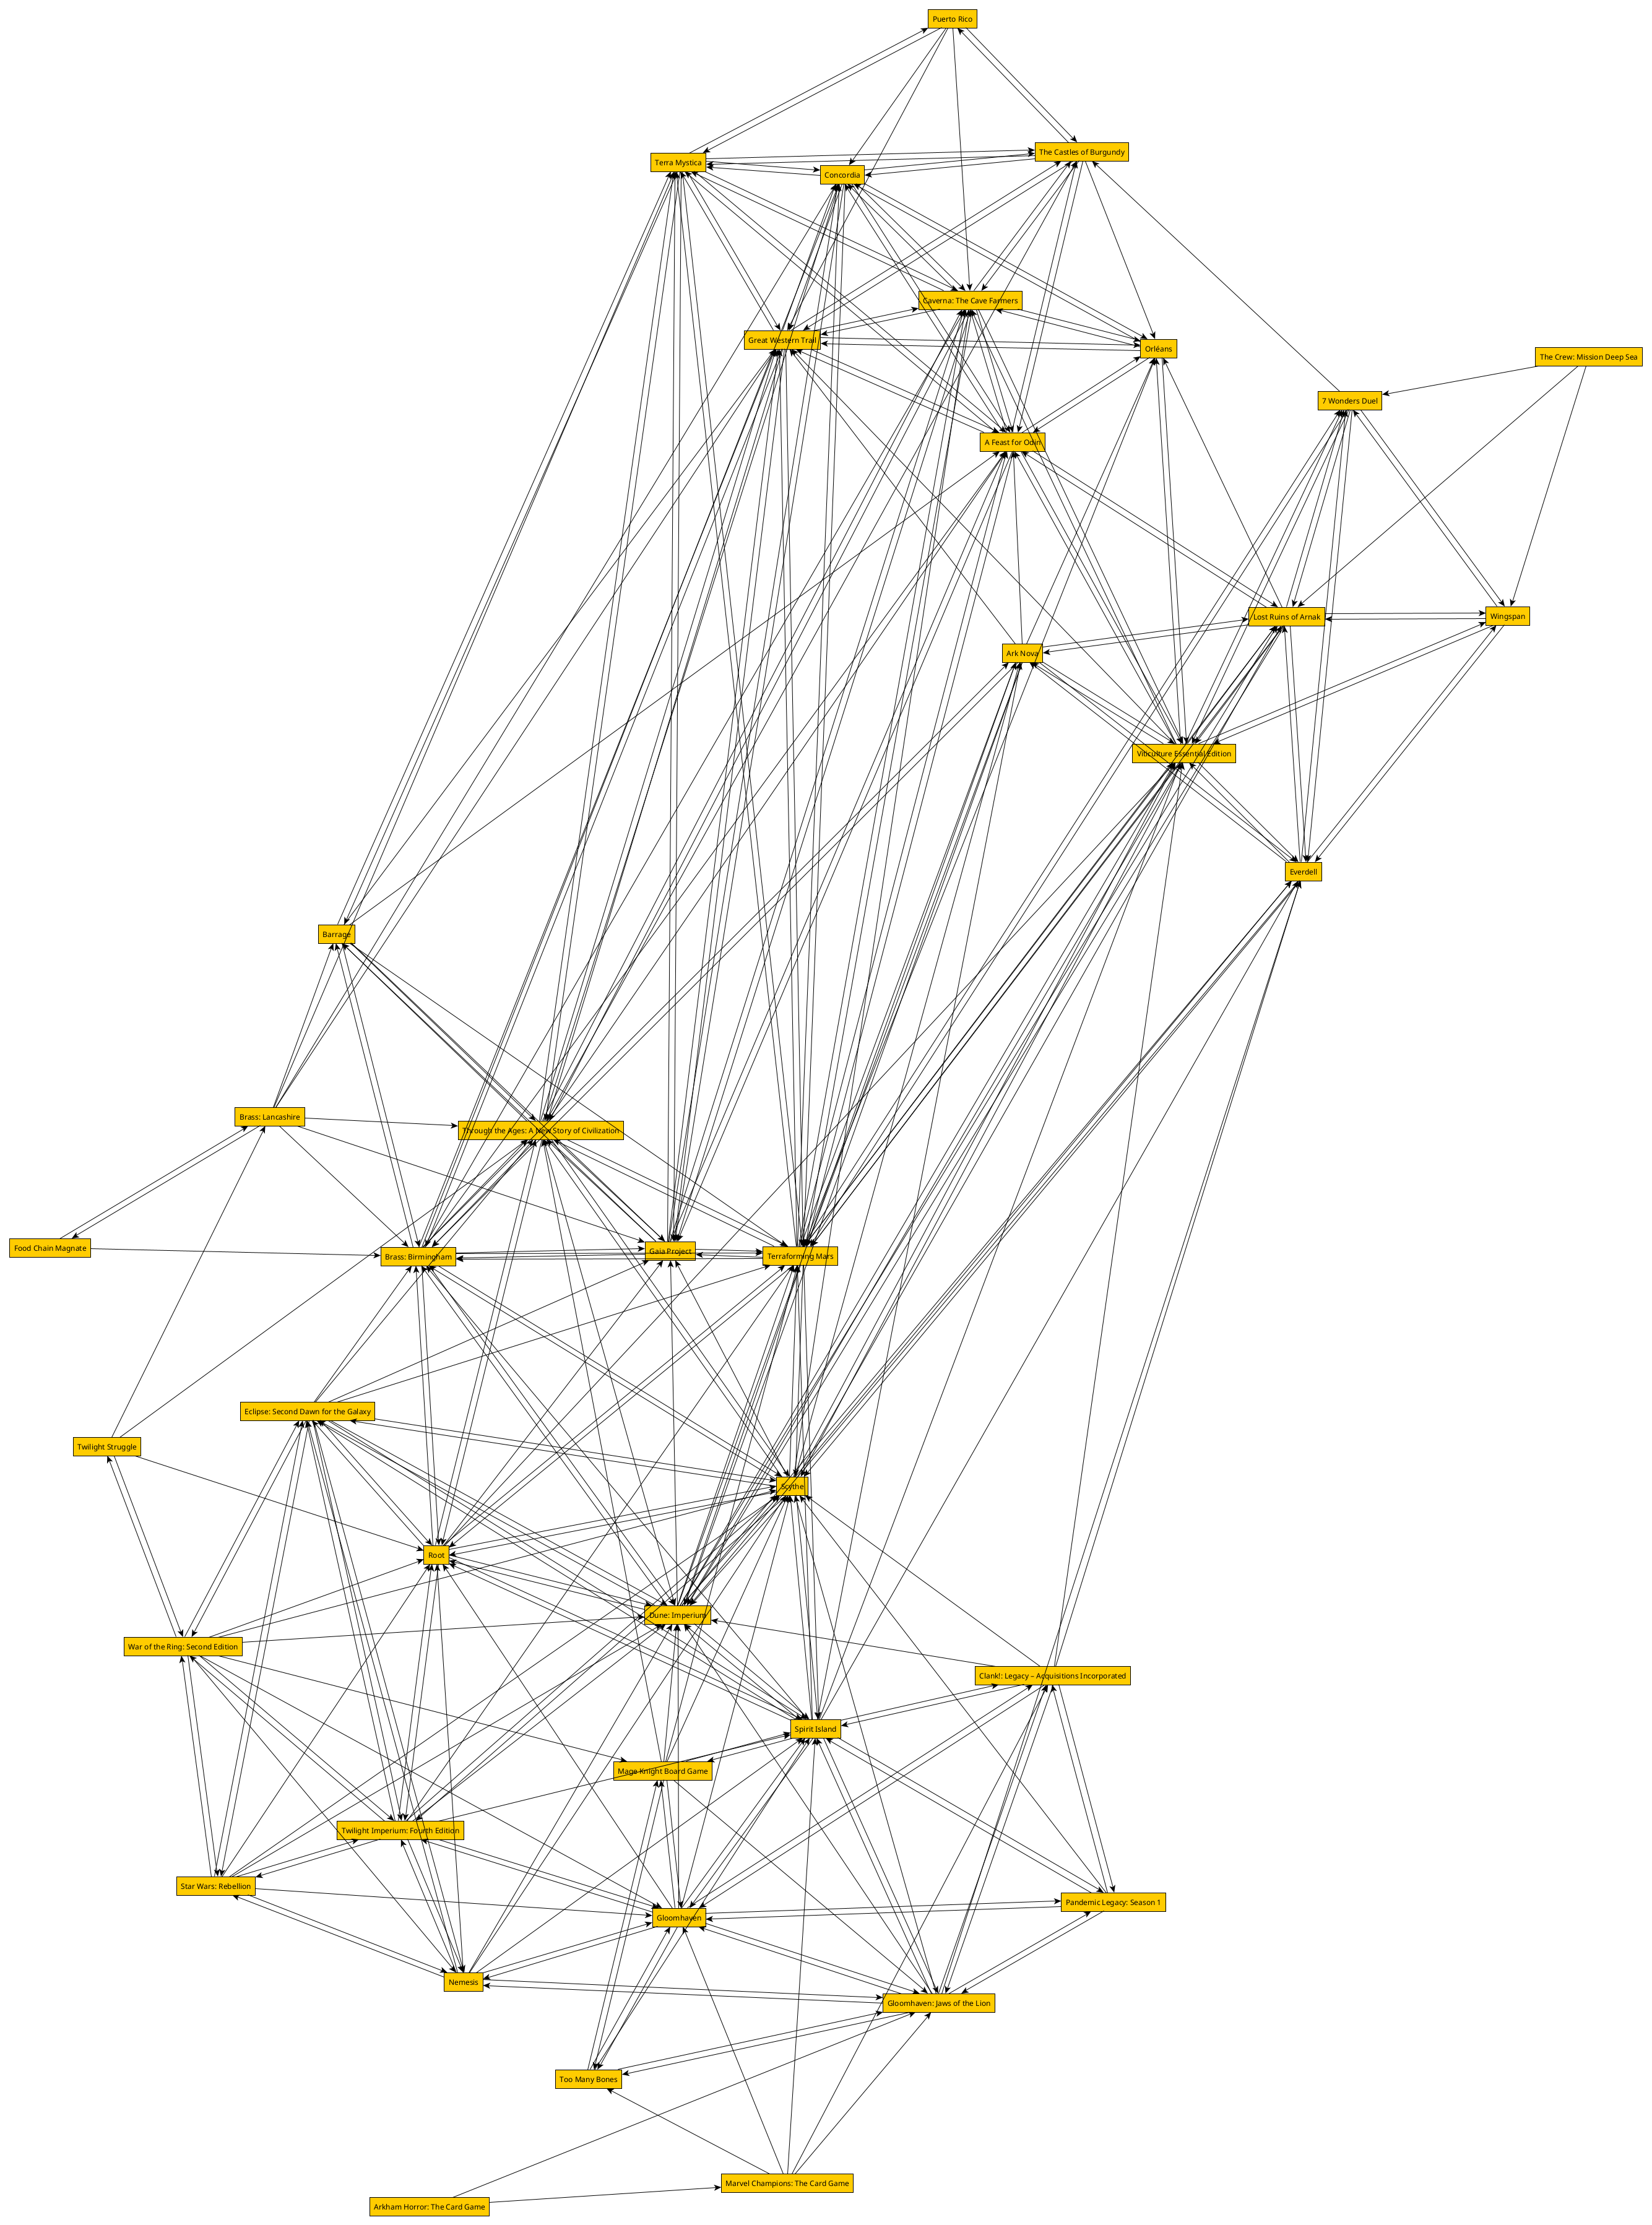
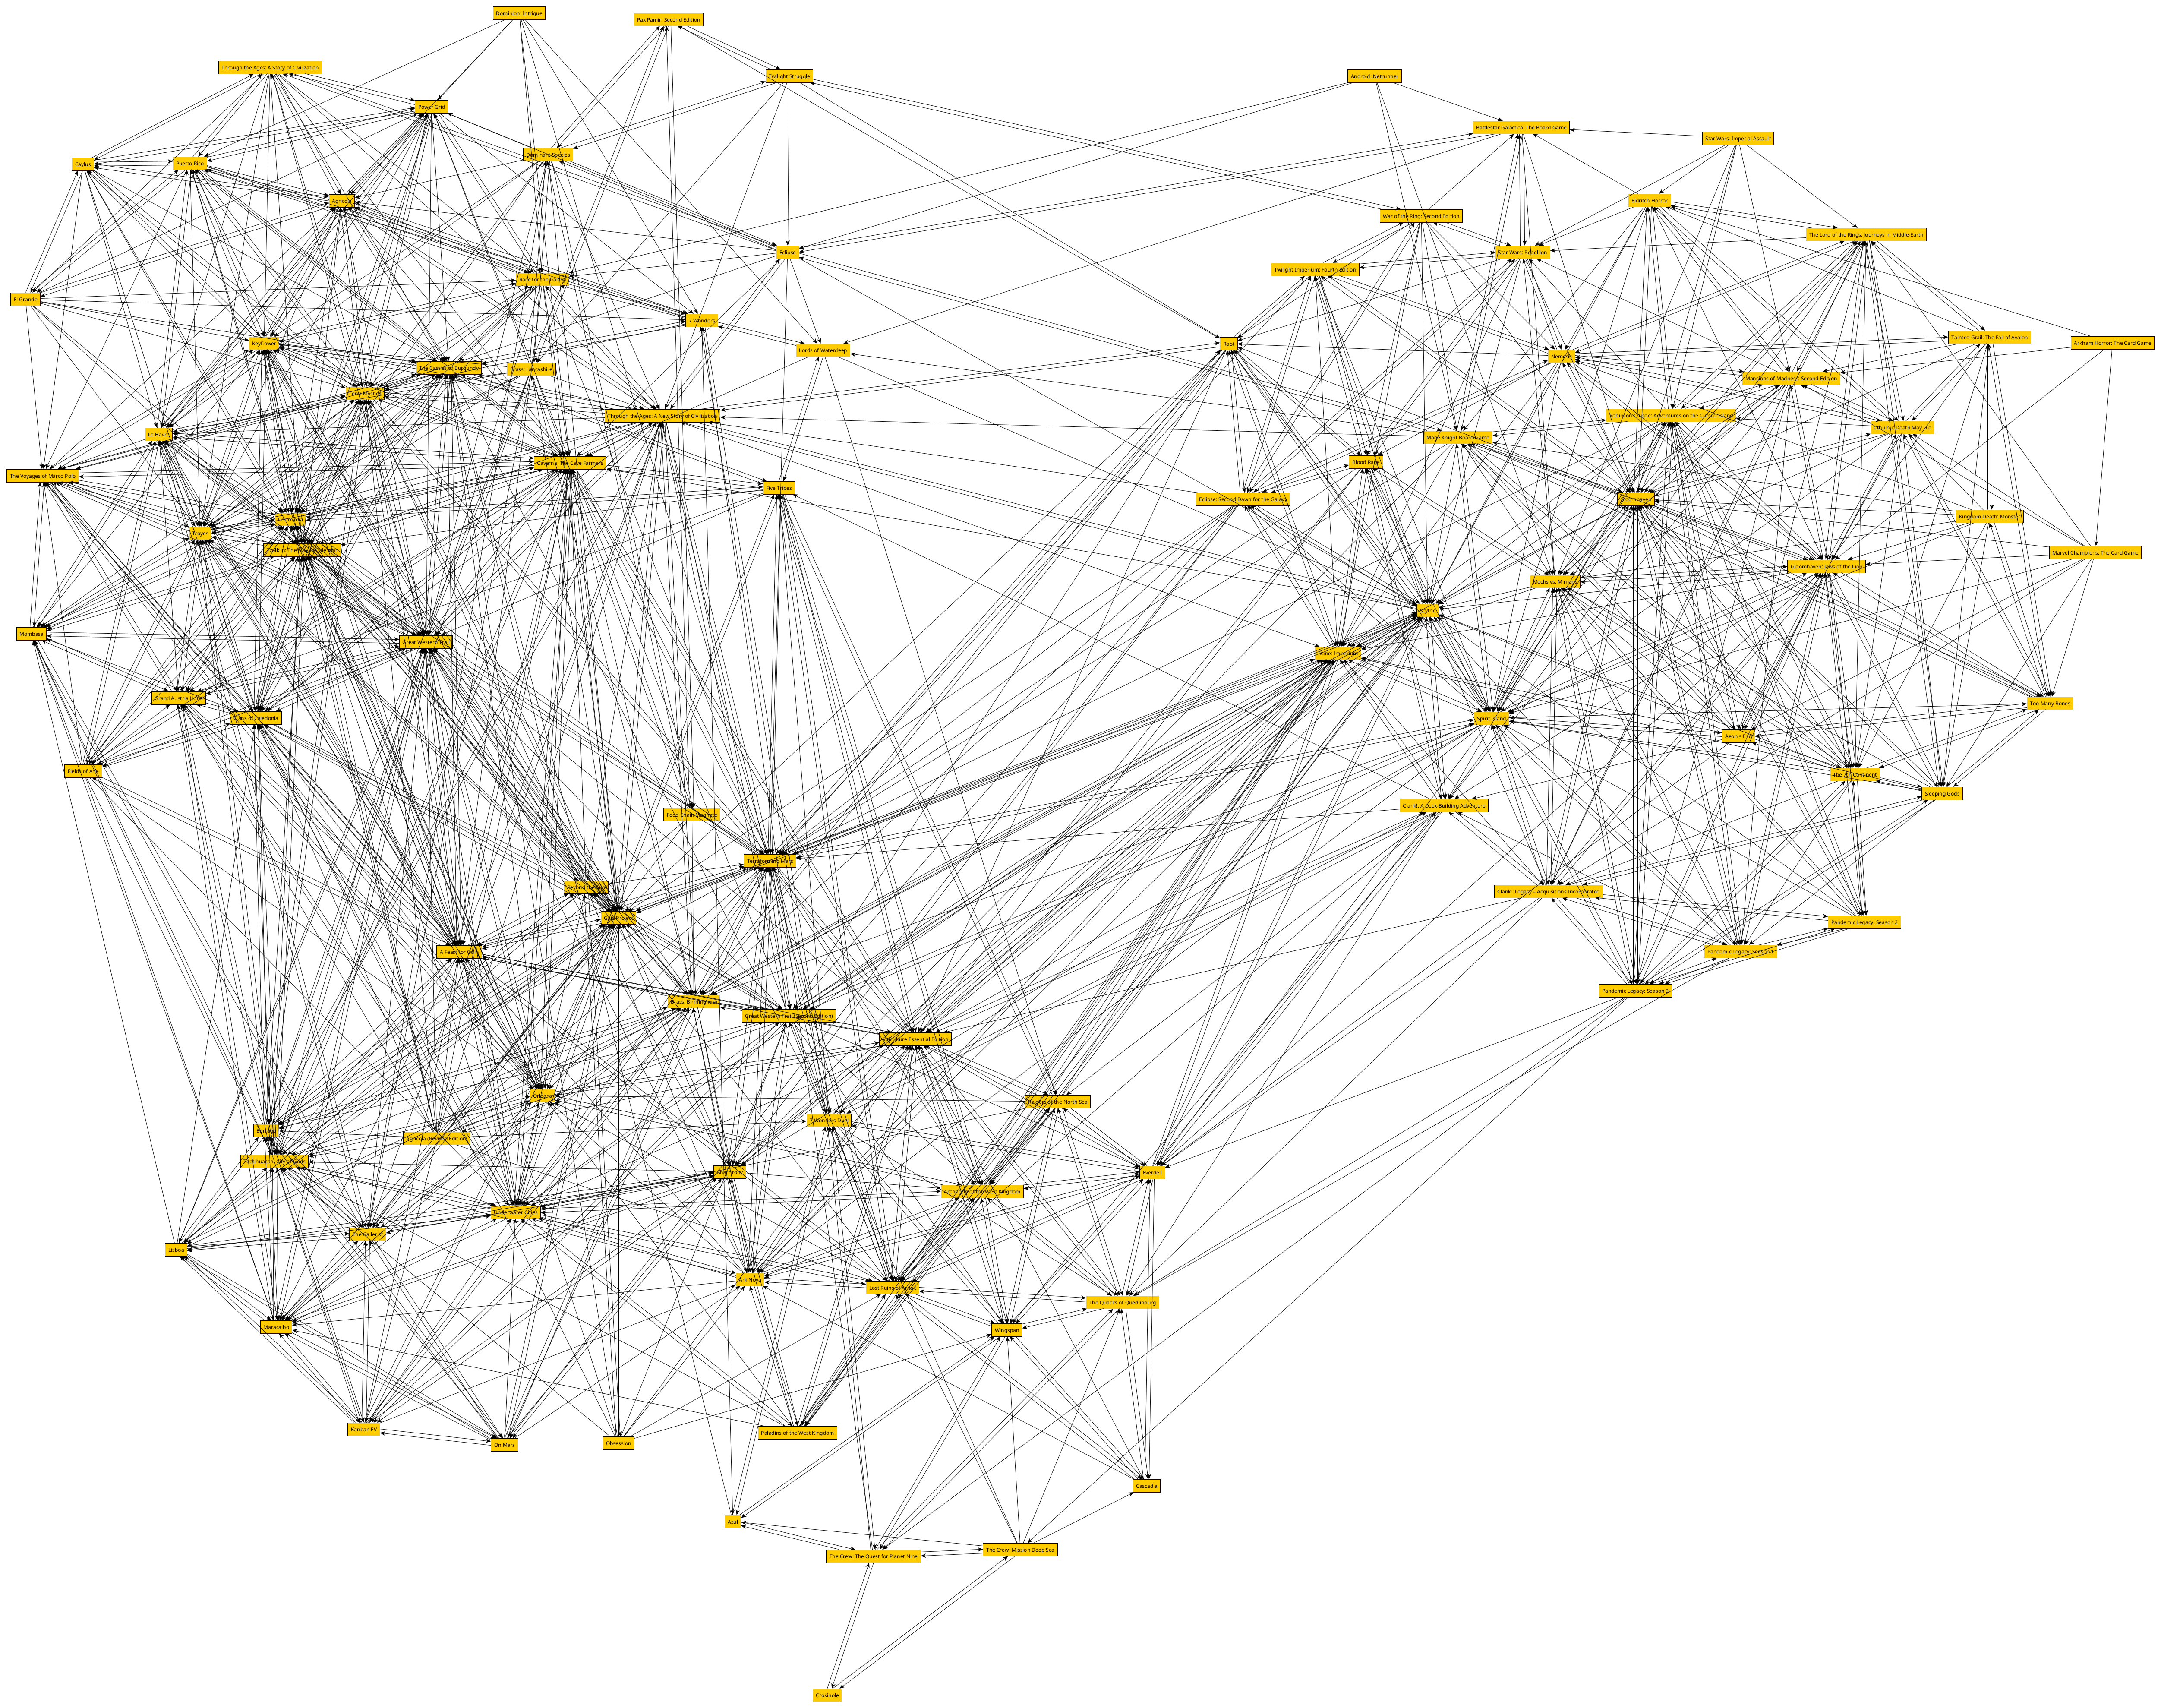
Every submission should represent at least the top-40 games. The remaining 60 games and all the metadata can be used at the contestants discretion. Below we show two simple plots (without metadata) of the top-40 and top-100 games computed with the organic layout in yEd.


Download links:
Evaluation
You are completely free to use any drawing style you wish. We leave it up to the contestants how they produce the drawing.
However, every submission should represent at least the top-40 games, identifiable (printed as a poster at A0 size) with their name. Furthermore, every submission should show the (main or interesting) “Fans Also Like”-relationships between these 40 games – but there is no strict requirement for all individual relations to be present and uniquely identifiable.
Your submissions will be judged on a list of criteria that includes, but is not limited to, readability, aesthetics, novelty, and design quality. We’re looking for submissions that show the general structure well, and reveal fun, interesting, curious and/or thought-provoking aspects of the provided data, but have no specific questions that need to be answered.
In case your submission showcases the result of a tool, you may also provide a link to the (online) tool. In case of sufficient submissions and no clear winner between submissions that do and do not showcase tools can be determined, the committee reserves the possibility to award multiple first, second, or third places.
Submission
Submissions will be handled through EasyChair at the web site
and must be received by
Friday, September 1st, 2023 (Anywhere On Earth).
The submission must be a pdf version of your visualization, suitable for printing on a large A0 poster. Your submission should also include the following information, either added to the pdf file, or in the abstract:
- A brief description on how the graph and layout were produced.
- (Optional) A link to a visualization illustrating the graph in a format of your choosing (e.g., an interactive tool).
- (Optional) A link to a web-friendly image of your visualization, max resolution 1000 by 1000 pixels. If not provided, we will use a picture of the submission for the website.
If your drawing requires special printing because of size, resolution, or color constraints, you are encouraged to print the submission as a poster yourself and bring it to the conference, preferably before the first session, but no later than noon on first day of the conference. At the conference, members of the committee can help you with hanging your poster. Please let us know via email that you are bringing the poster yourself.