Contest 2025: Creative Topic
Creative Topic: Dark
Dark is a German sci-fi thriller about time travel, fate, and family secrets. Set in the small town of Winden, it follows four families entangled in a time loop spanning multiple generations. As disappearances and strange events unfold, the story weaves a complex narrative of interconnected pasts, presents, and futures.
For this year’s creative topic, we invite participants to explore the intricate relationships between events, characters and timelines in Dark. The dataset consists of events in the series, and characters involved in each event.
The rest of the contest description and the whole dataset contain spoilers about Dark (:
The most interesting part of the dataset is the temporal aspect: while storyline visualizations are a well-studied concept in Graph Drawing, what about storyline visualizations with special perks, such as time travel?
The Nörrkoping Decision Arena
A special dataset requires a special setting. This year, we have access to the Nörrkoping Decision Arena, a state-of-the-art facility featuring a 360-degree screen. The following is a link to the facility:
Link to the Nörrkoping Decision Arena
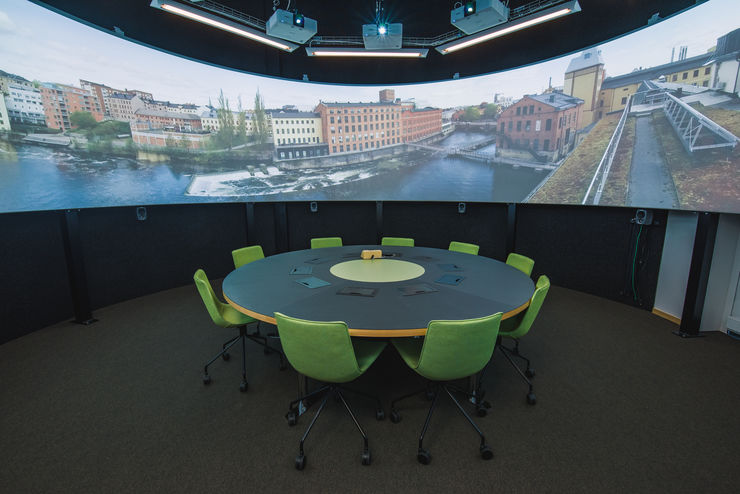
The submissions received for the contest will be displayed in the arena, allowing the audience to immerse themselves in the visualizations. Each submission to be exhibited will be displayed for a set amount of time, allowing for judges and participants to explore the visualizations in detail.
The 360-degree screen can be used for interesting features to be integrated into the visualization of a dynamic network. The authors are encouraged to think about how the visualization can be enhanced by the unique capabilities of the arena. For instance, how can the time travel aspect of the series be visualized in a way that is only possible in a 360-degree setting?
Because of the special setting, the submission format this year is a bit special: we are requesting very wide images, with a resolution of 12288 x 1200 pixels. This is a 10.24:1 aspect ratio, which is suitable for the 360-degree screen. We can not support any form of animation or interactivity at the moment, so the submission has to be a static image.
The preview system
To allow participants to preview their submission, the amazing Nico Reski has created a three.js based preview system. The system allows you to preview your submission in a 360-degree setting, and to see how it would look like in the arena. The system is available at the following github repository: link to the repository. The repository contains the source code of the web-based application, including documentation on (1) how to use (offline), (2) interact, and (3) add your own images.
The following is an example of the preview system:
The canvas above contains an example of the preview system - use your mouse to look around. You can also press a directional key to see a different example.
The system will be also used to display the submissions to this contest on this same website, after the conference is over. This way, we will preserve the three-dimensionality of the visualizations accessible for anyone to explore in the future.
Dark Dataset
Download:
The dataset is taken from a visualization created by aldersonloop59 and distributed on reddit. The visualization can be found here: Dark Graph. Note that, as it is particularly complex, it might take some time to load. Additional explanations for the visualization are documented in this reddit post.
Each node in the graph (where nodes correspond to events) has a number of features associated:
"ID": "Incremental ID for each event",
"Description": "Description of the event",
"Date": "Date of the event in (dd-mm-yyyy) format",
"Important Trigger": "Boolean value indicating if the event is an important trigger for the series",
"Death": "Boolean value indicating if the event involves a death",
"Characters": "List of characters involved in the event",
"World": "In which world did the event take place?"
A note about the World attribute: the series has three worlds, which are denoted as Jonas, Martha, and Origin. From time to time, the characters can jump between worlds. Different versions of the same character can exist in different worlds - thus, Jonas is for example denoted in event descriptions and character lists as Jonas (J) and Jonas (M), describing the Jonas from the Jonas and Martha worlds, respectively.
Edges in the dataset represent cause and effect relationships between events. Each edge has a number of features associated:
"ID": "Incremental ID for each edge",
"Source": "ID of the source event",
"Target": "ID of the target event",
"Type": "Type of relationship between the events",
"Description": "Few edges include a description of the relationship",
Edges can be of different types: edges denoted as Normal denote simple cause and effect relationships (even though these can still be quite complex and traverse multiple days). Some edges, instead, denote time travel. These are described as either Successful Time Travel or Failed Time Travel. World Swap edges denote where characters swap between worlds. Quantum Entanglement and Quantum Entanglement (Causality Break) edges denote cycle-breaking events.
Because the dataset is quite large and complicated, you can decide to only focus on a section of it. For instance, you can decide to exclusively represent the events in Jonas’ world, which would correspond to the events presented in Season 1 and the majority of Season 2. We appreciate submissions that focus on the entire dataset, but we leave to the participants’ creativity and discretion to use the features at hand in the way they see fit. Participants might also decide on alternative interpretations of the data, such as using edges in the network to instead represent character co-occurrences.
Evaluation
You are completely free to use any graph drawing style you wish. We leave it up to the contestants how they produce the drawing. Any tool is allowed to generate the poster and the drawing.
The expectation is that the visualization represents the relational information between the vertices. Whether all edges and vertices are to be visualized is left to the authors: we would ideally push to visualize every edge individually, but authors might decide to only select a subset of the information in the dataset. The visualization submitted should still strive to represent the majority of the relational information, without sacrificing clarity. Furthermore, every submission should show use at least some of the available metadata. To facilitate the choice for which metadata to visualize, we ask each submission to specify one or a few questions that you want to answer with your visualization. Your submission should strive to structurally and thematically provide an answer to your own proposed question(s).
Your submissions will be judged on a list of criteria that includes, but is not limited to, readability, aesthetics, novelty, and design quality. We’re looking for submissions that show the general structure well, and reveal fun, interesting, curious and/or thought-provoking aspects of the provided data.
In case your submission showcases the result of a tool, you may also provide a link to the (online) tool. Note that even in this case, your submission should be able to provide a compelling drawing in a static and non-interactive way, for example on a poster; see also Submission for the exact submission format. In case of sufficient submissions and no clear winner between submissions that do and do not showcase tools can be determined, the committee reserves the possibility to award multiple first, second, or third places.
Submission
Submissions are handled through Easychair.
Link to submission system: https://easychair.org/conferences/?conf=gdc2025
and must be received by
Monday, 1st September 2025 (Anywhere On Earth)
The submission must be a high-res png version of your visualization. The resolution should be 12288 x 1200 pixels. The aspect ratio should be 10.24:1. Your submission should also include the following information, either added to the pdf file, or in the abstract:
- A brief description on how the graph and layout were produced (max 2 DIN A4 pages - consider this an extended abstract).
- (Optional) A link to a visualization illustrating the graph in a format of your choosing (e.g., an interactive tool). This will be looked at by the jury, but not displayed during the conference.
For any inquiries or questions, please contact the contest committee at:
gdnvcontest@gmail.com