We have two creative topics that are judged independently:
Participants may submit drawings of both graphs (or only one graph).
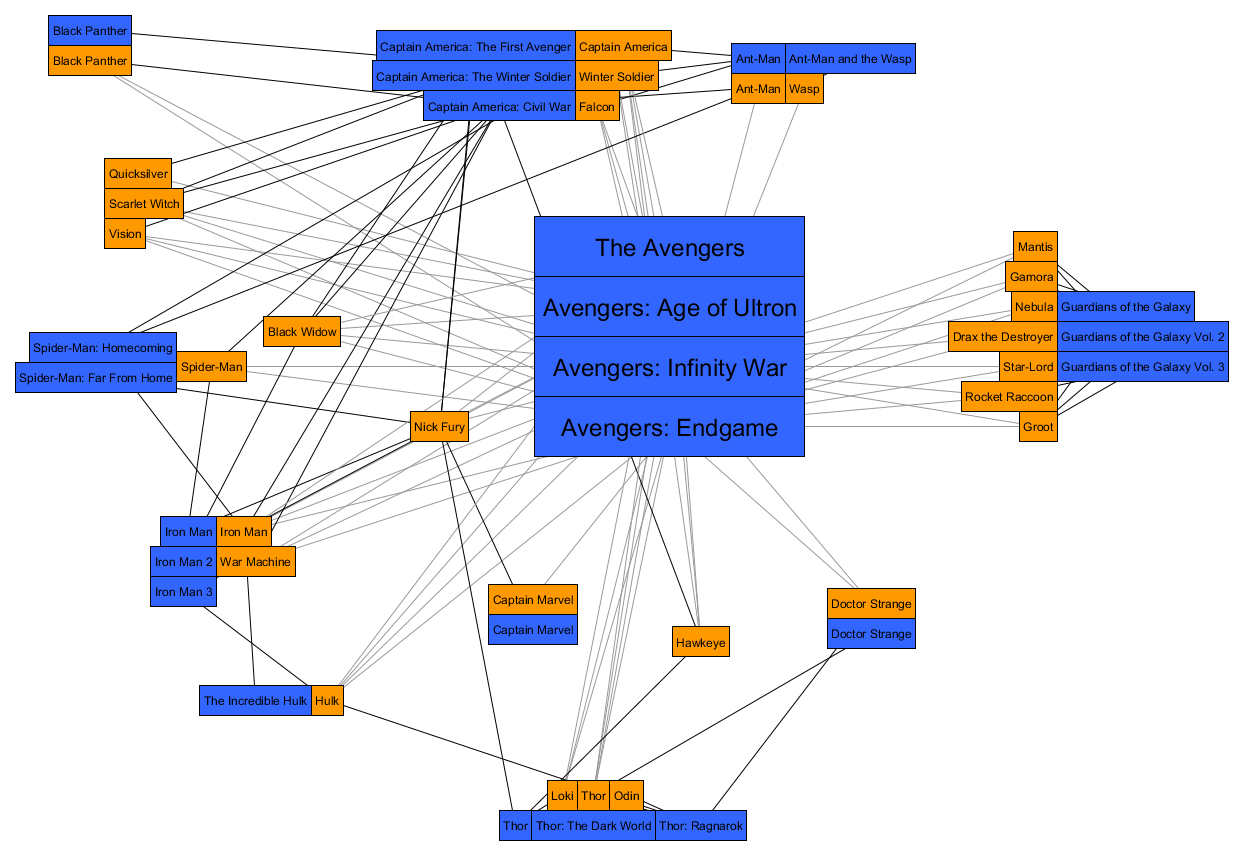
The Marvel Cinematic Universe is a media franchise and shared universe that is centered on a series of superhero films, based on characters that appear in comic books published by Marvel. The data set describes a selection of 28 characters (heroes) and in which of the 24 movies released so far they appeared. The data was compiled from the Marvel Cinematic Universe Wiki.

The graph is provided in GraphML format. Each node has a data key type that describes whether it corresponds to a hero or to a movie, and a data key name that contains the name of the hero or the title of the movie. There is an edge between a hero-node and a movie-node if the hero appeared in the corresponding movie.
The graph is available here.
The data set describes 151 food recipes extracted from the
TheMealDB database.
TheMealDB was built in 2016 to provide a free data source
API for recipes online. TheMealDB originated on the Kodi forums as a way to
browse recipes on a TV.
The provided data set contains three files.
File “ingredients" lists 297 food ingredients, e.g.
"Beef","Flour","Red
Wine","Onion","Carrot","Thyme",”Mustard".
File “areas” contains 11 areas (countries) that are popular
for their dishes around the globe: "American”, "British”,
"Chinese","French","Greek","Indian","Italian","Japanese","Mexican","Spanish",”Thai”.
File “meals” contains 151 recipes. Each record contains the following properties.
| category | (Optional) The category to which the meal belongs. |
| ingredients |
The list of ingredients in the meal. All the ingredients used in this field can be found in the file "ingredients". |
| name | Name of the meal. |
| area | Area where the meal is originating from. All the areas are listed in the file "areas". |
Here is an example of a record contained in the file
"meals":
"Chocolate Gateau": {
    "category": "Desert",
    "ingredients”: [
        "Chocolate",
        "Butter",
        "Milk",
        "Egg",
        "Sugar",
        "Flour"
    ],
    "name": "Chocolate Gateau",
    "area": "French"
}
The task is to visualize the data either in a form of a
graph or any other form the authors prefer. The authors can
decide whether they omit relatively uninformative parts of
the data and the optional field "category", and should
outline their decisions in the submission.
The data set is available here.
For the creative topics, you are completely free to use any drawing style you wish. Your submissions will be judged both on aesthetic value and on the clarity of information displayed.
Submissions will be handled through EasyChair at the web site
and must be received by September 05 (23:59 PDT). The submission must be a pdf version of your visualization, suitable for printing on a large A0 poster. Your submission should also include the following information, either added to the pdf file, or in the abstract:
If your drawing requires special printing because of size, resolution, or color constraints, you are encouraged to submit via hard-copy to the address below. In this case, please contact us in advance and make sure that your submission is received no later than September 15. Please still submit the remaining items via EasyChair.
Philipp Kindermann
Lehrstuhl für Informatik I
Universität Würzburg
Am Hubland
97074 Würzburg
Germany
