
GD Contest
Live ChallengePermalink
Planar polyline edge-length ratio on a fixed grid
We shall hold the Graph Drawing Challenge in a format similar to a typical programming contest. At the start of the challenge, teams of contestants will receive the collection of challenge graphs. After one hour, the teams will submit their final drawings and the team with the highest cumulative score wins.
Teams will be allowed to use any combination of software and human interaction systems to produce the best drawings. To accommodate both teams wishing to prepare for the challenge and teams wishing simply to participate, with no preparation, we will be providing, in advance, a small set of graph visualization tools. These tools are not necessarily meant to solve the problems at hand but are there to help the teams manually draw and manipulate the graphs. To further the development of new tools and to help promote tools already in existence, teams are also welcome and highly encouraged to create and bring their own software packages.
There will be two categories in the challenge that are judged independently:
- Automatic: This category is for teams using their own tool. Since we assume that the tool contains special algorithms to solve the challenge automatically, these teams will receive larger challenge graphs. Manual fine-tuning is allowed.
- Manual: This category is for teams using the provided graph editor. The graph editor does not contain any specific algorithm to solve the challenge. It allows only to change vertex locations. This category is for creating manual solutions without help of an automatic algorithm. Teams in this category will receive smaller challenge graphs. The tool will be available in the submission system.
The challenge focuses on minimizing the planar polyline edge-length ratio on a fixed grid. The input graphs are planar undirected graphs. For the manual category, some planar drawing will also be provided.
The planar edge-length ratio of a straight-line drawing is defined as the ratio between the length of longest edge and the length of the shortest edge. There has been recent attention to this topic with several publications, for example.
The planar polyline edge-length ratio is a generalization of the planar edge-length ratio where edges do not have to be straight-line segments, but can be polylines with a maximum number of bends per edge defined by the input. In difference to the GD Contest 2021, we will calculate the planar polyline edge-length ratio as the ratio between the longest edge and the smallest Euclidean distance between adjacent vertices.
Here is an overview of the rules for the challenge:
- The challenge will take place for one hour during the Graph Drawing Symposium.
- Teams may consist of up to three participants each. Each team should bring their own computers and/or software tools to the challenge.
- Software tools for manually solving the challenge will be provided for each team with time available prior to the challenge to set-up and practice with the system.
- At the start of the challenge, contestants will receive a collection of five to ten graphs. The graphs will have up to a few thousand nodes.
- The allowed grid size will be specified in the file format, but will not be larger than 1,000,000 x 1,000,000.
- The maximum number of allowed bends for each edge will be specified in the file format.
- For each graph, the team submitting the drawing with the smallest planar polyline edge-length ratio receives the highest score. The graphs in the manual category come with a planar embedding, but the graphs in the automatic category do not necessarily have an initial embedding.
- Scores for other submissions of the same graph shall be weighed with respect to this value. The team with the highest total score over all graphs wins.
File Format
For the GD Contest 2022, a JSON format described below will be used. The contest graphs will be provided in this format and the final submissions should be prepared using the same format. A valid JSON file consists of the following entries:
- nodes: An array with one element per node of the graph. Each element has the following entries:
- id: The id of the node. Has to be an integer between 0 and #nodes-1.
- x: The x-coordinate of the node. Has to be an integer between 0 and width.
- y: The y-coordinate of the node. Has to be an integer between 0 and height.
- edges: An array with one element per edge of the graph. Each element has the following entries:
- source: The id of the source node.
- target: The id of the target node.
- bends (optional): A list of bend points, specified by x- and y-coordinate, ordered in the direction of the source to the target of the edge.
- width (optional): The maximum x-coordinate of the grid. Has to be a non-negative integer. If unspecified, the width is set to 1,000,000.
- height (optional): The maximum y-coordinate of the grid. Has to be a non-negative integer. If unspecified, the height is set to 1,000,000.
- bends: The maximum number of bends allowed per edge.
Sample File
Below is a simple example:
{ "nodes": [
    { "id": 0, "x": 1, "y": 0 },
    { "id": 1, "x": 0, "y": 2 },
    { "id": 2, "x": 2, "y": 2 },
    { "id": 3, "x": 1, "y": 4 }],
  "edges": [
    { "source": 0, "target": 1 },
    { "source": 0, "target": 2 },
    { "source": 1, "target": 2 },
    { "source": 1, "target": 3,
        "bends": [
          { "x": 0, "y": 4 }]},
    { "source": 2, "target": 3,
        "bends": [
         { "x": 2, "y": 3 },
         { "x": 1, "y": 3 }]}],
  "width": 2,
  "height": 4,
  "bends": 2 }
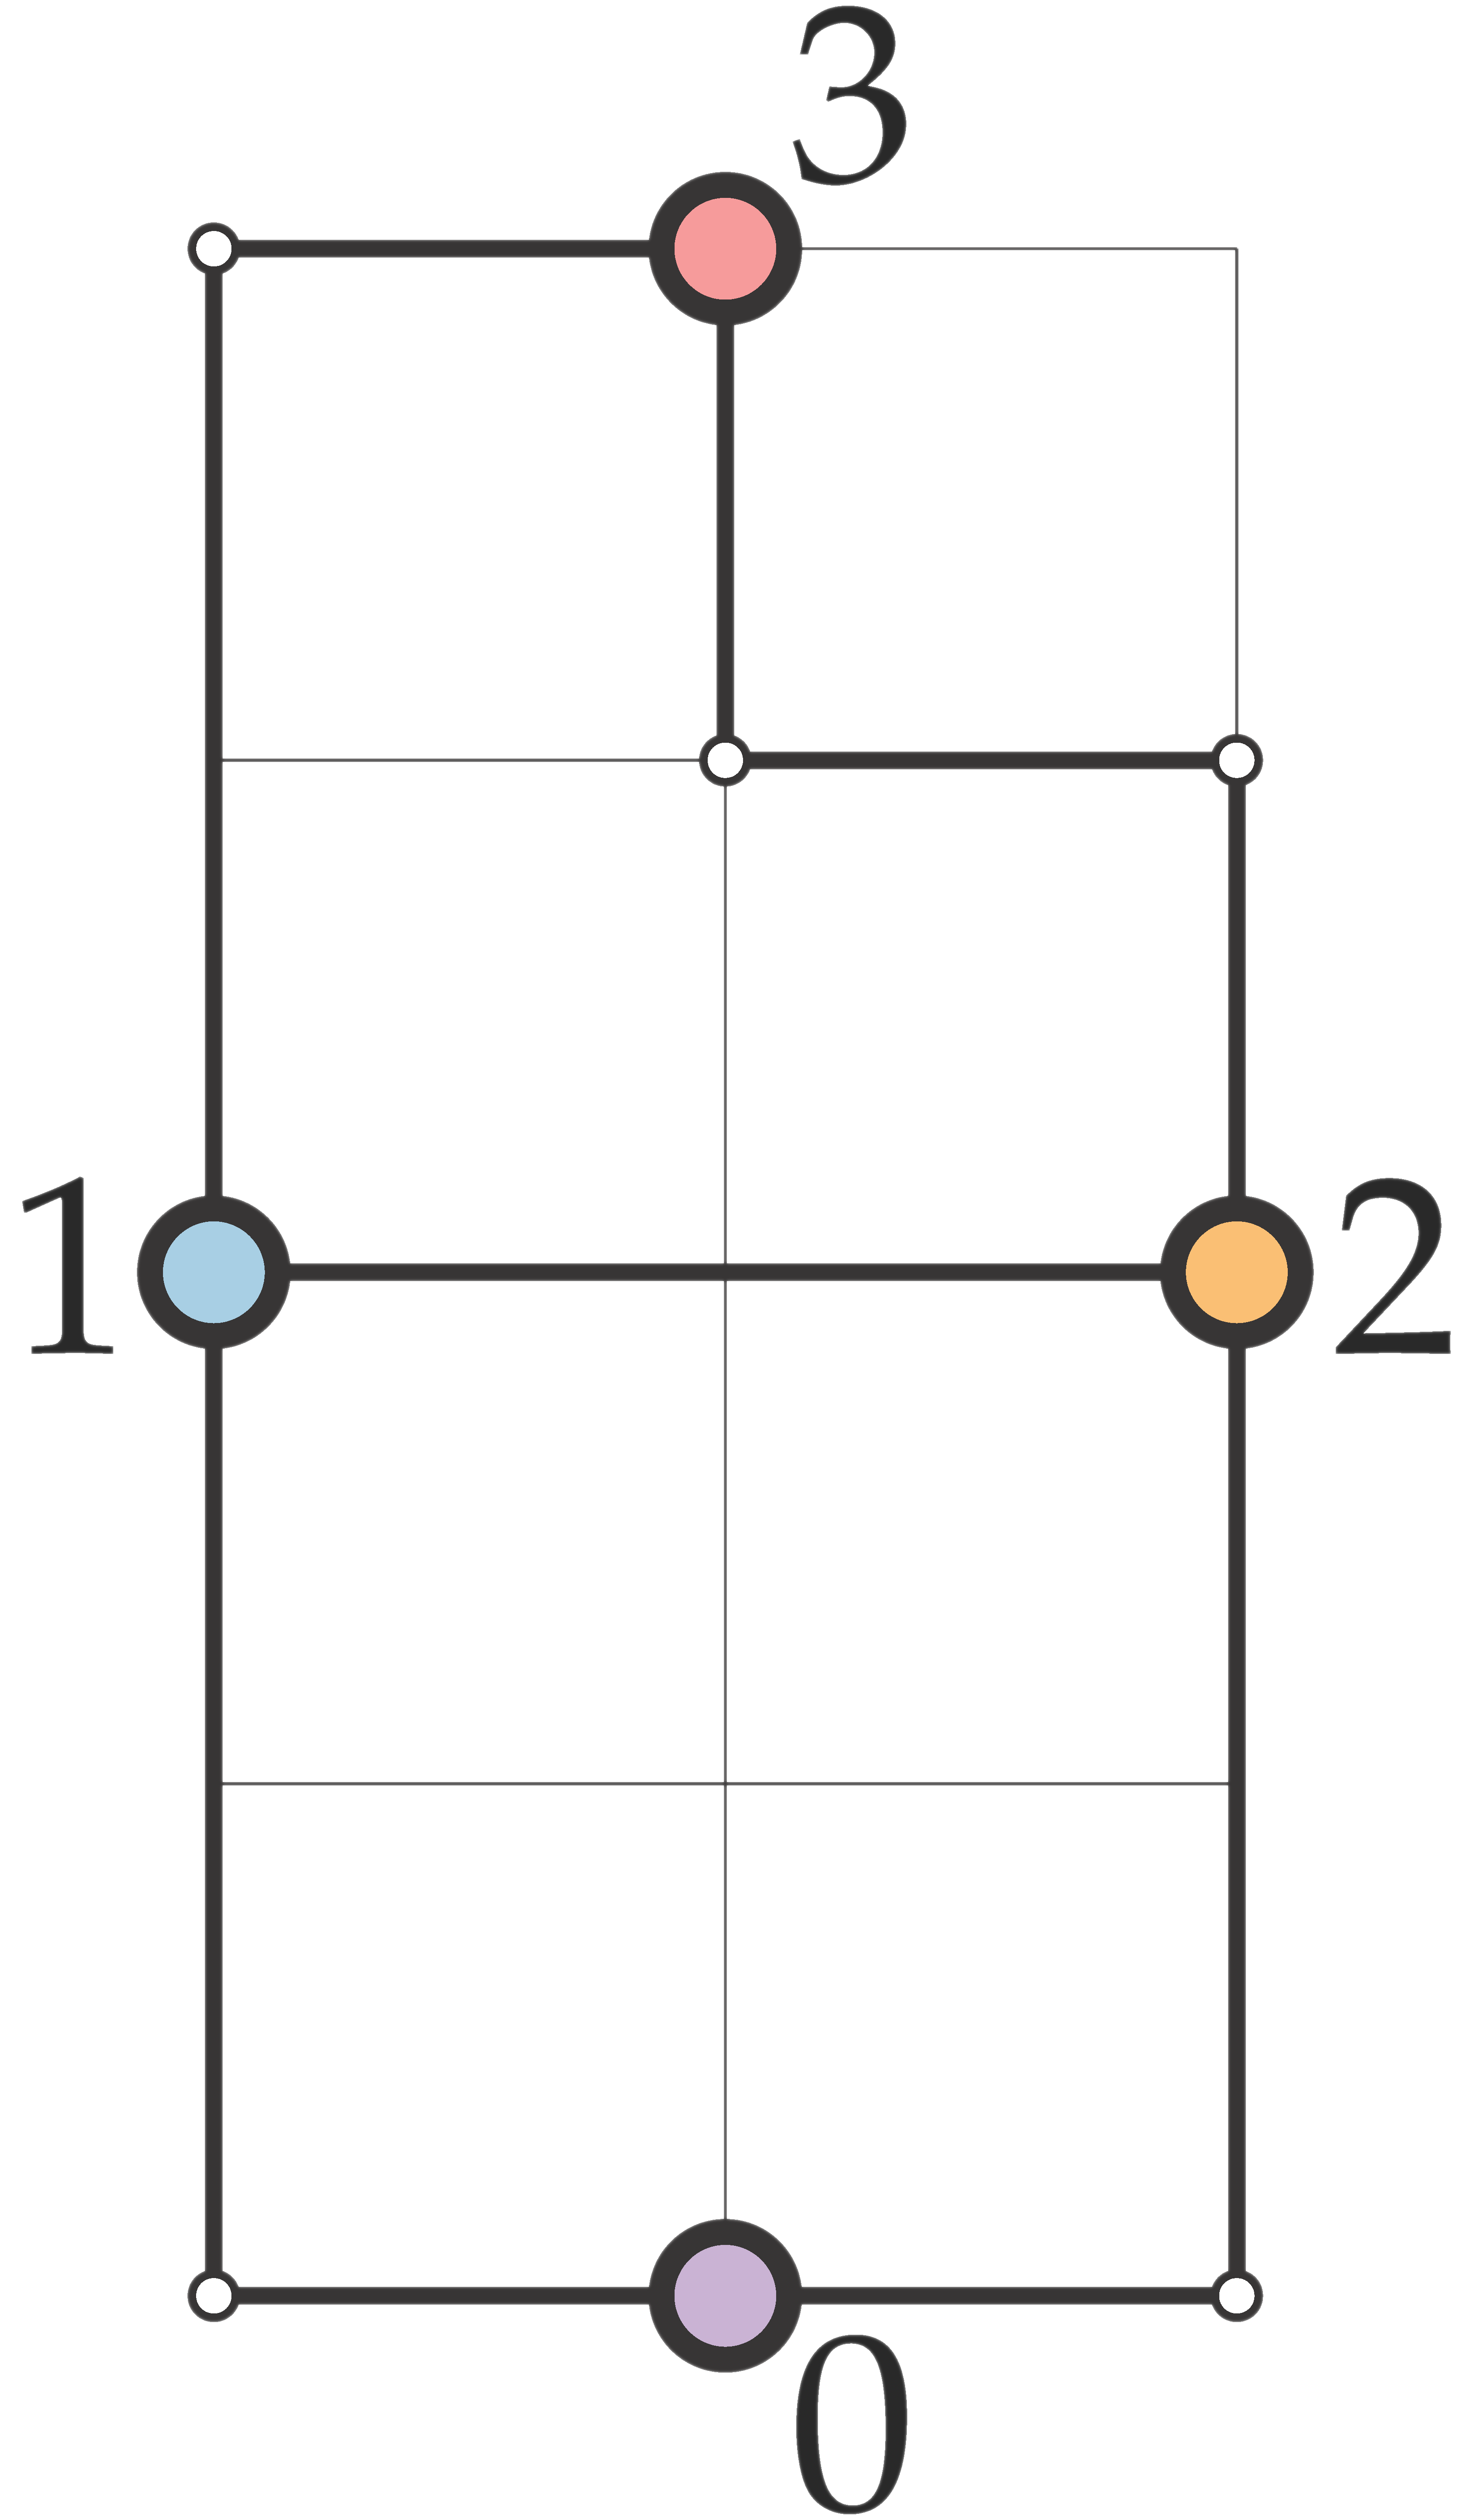
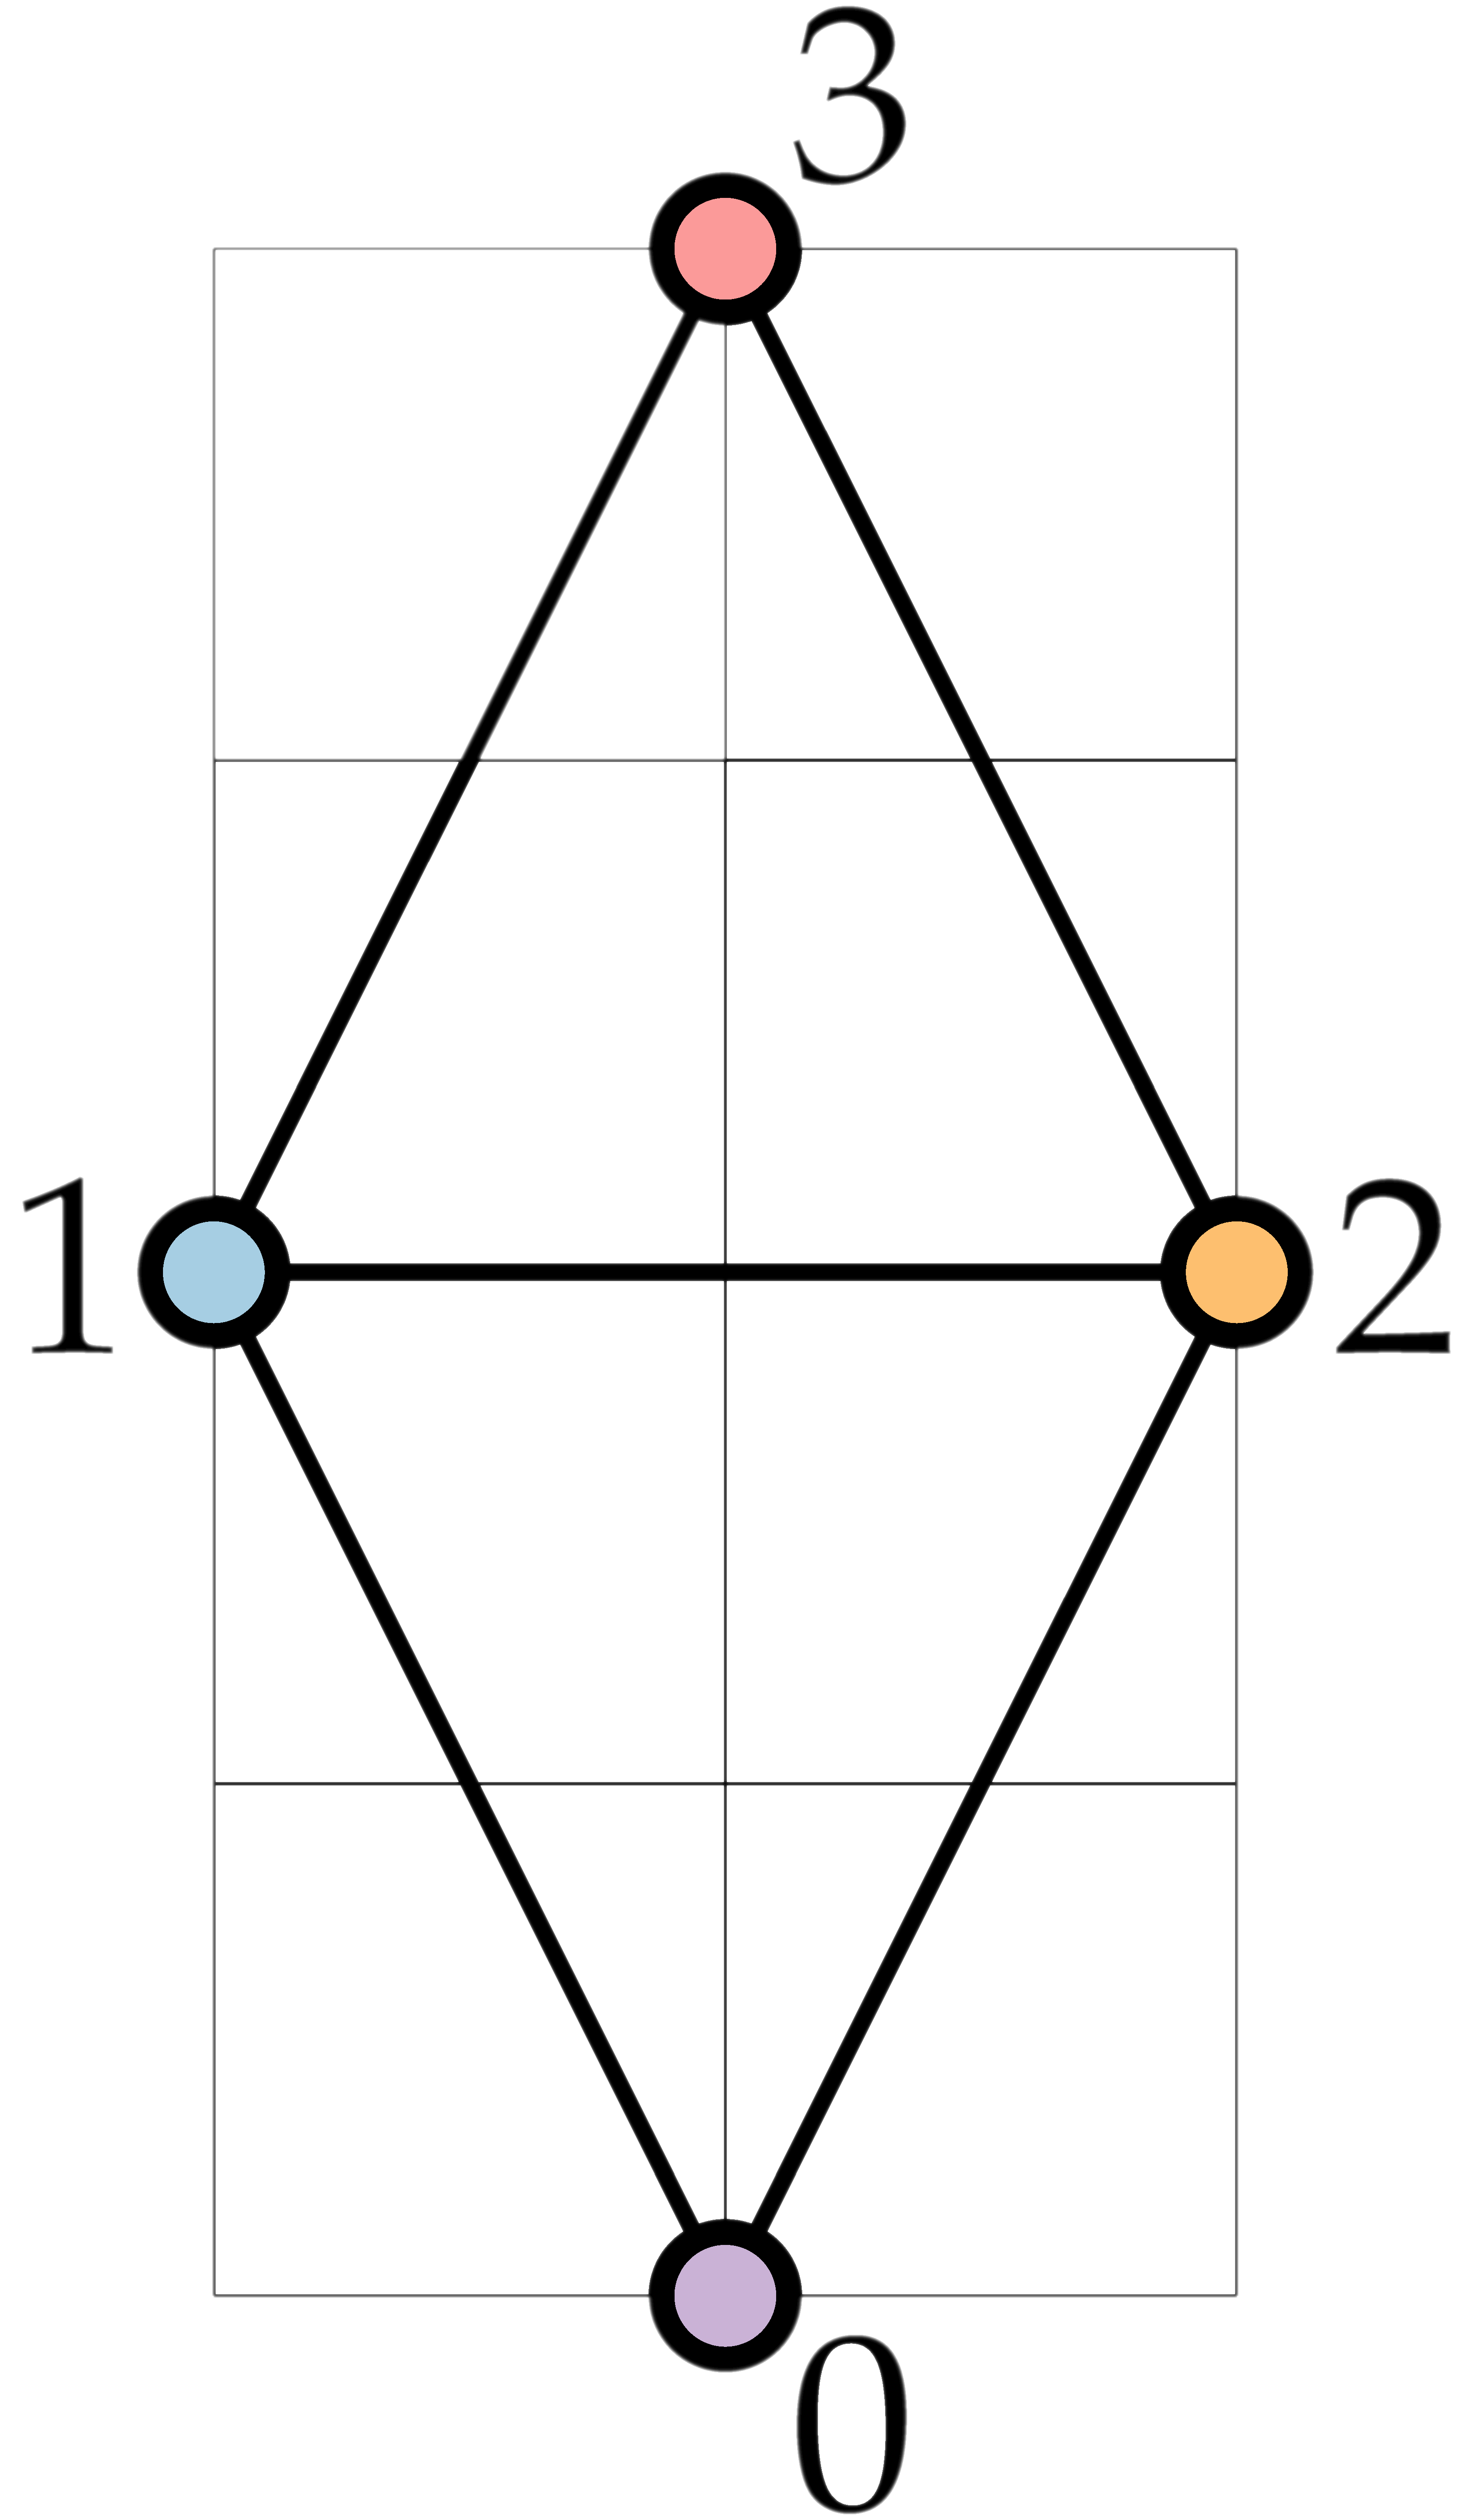
The left drawing below corresponds to this input file. The longest edge (between nodes 1 and 3) has length 3, the smallest Euclidean distance between adjacent nodes (between nodes 1 and 2) is 2, so the edge-length ratio is 1.5. By drawing every edge straight-line, the graph can be drawn with a better edge-length ratio, see the right drawing below. The longest edge (between nodes 1 and 3) has length √5, the shortest Euclidean distance between adjacent nodes (between nodes 1 and 2) is 2, so the edge-length ratio is ~1.12.
 |
 |
|---|
How to participate
The Live Challenge will be part of the 28th International Symposium on Graph Drawing and Network Visualization, and will take place on
If you wish to participate in the manual category, you will attempt to solve the problems using a supplied tool. (Note that the target function changed slightly compared to last year.)
If you wish to participate in the automatic category, you can use any software you wish to solve the problems, including the supplied tool (however, problems instances will be much larger than in the manual category).
You may use at most one computer per team.
.Remote participation is possible in both the manual and automatic category.
The challenge will be run through an online submission system. You can already visit the system and try out the graphs from last year's challenge to get yourself familiar with the provided tool.