Overview
GD 2010 Home
Contest Overview
Edge Routing Graph 1
Edge Routing Graph 2
Mystery Graph
File Format
Challenge Overview
File Format
Sample File
|
Graph Drawing Challenge
Orthogonal layout with minimal longest edge
We shall hold the Graph Drawing Challenge
in a format similar to a typical programming contest. At the start of
the challenge, teams of contestants will receive the collection of
challenge-graphs. After one hour, the teams will submit their final
drawings and the team with the highest cumulative score wins.
Teams will be allowed to use any combination of software and human
interaction systems to produce the best drawings. To accommodate both
teams wishing to prepare for the challenge and teams wishing simply to
participate, with no preparation, we will be providing, in advance, a
small set of graph visualization tools. These tools are not
necessarily meant to solve the problems at hand but are there to help
the teams manually draw and manipulate the graphs. To further
the development of new tools and to help promote tools already in
existence, teams are also welcome and highly encouraged to create and
bring their own software packages.
There exist two categories in the challenge that are judged differently:
- Automatic -
This category is for teams using their own tool.
Since we assume that the tool contains special algorithms to solve
the challenge automatically, these teams will receive larger
challenge graphs. Manual fine-tuning is allowed.
- Manual -
This category is for teams using the provided graph editor.
The graph editor does not contain any specific algorithm to solve
the challenge. It allows only to move nodes and to re-route edges.
This category is for creating manual solutions without help of
an automatic algorithm. Teams in this category will receive smaller
challenge graphs.
The challenge focuses on
minimizing the length of the longest edge in a planar orthogonal layout.
The challenge graphs will be planar and 4-ary (maximally 4 incident edges
per node).
Nodes have no dimension, they can essentially be considered as points.
All drawings must have the following properties:
- All nodes are placed on distinct integer grid locations.
- Edges must be routed orthogonally, that is, they must consist of
segments that are stictly horizontal or strictly vertical.
- All edge bends must be on integer grid coordinates.
- Edge crossings are not allowed. The layout must be planar.
- Node and edge overlaps are forbidden.
- There is no limit on the number of bends (but all bends must be
on integer grid coordinates).
- The length of an edge is the sum of its segment lengths.
- The length of the longest edge of the layout is the scoring
criteria.
We are looking for the layout that has the smallest longest edge.
The results are judged solely with respect to the length of the longest
edge.
The other edges, except the longest edge, are not taken into account
for the score.
Other aethetic criteria are also not taken into account.
This allows an objective way to qualitatively evaluate a given drawing.
Here is an overview of the rules for the challenge:
-
The challenge will take place for one hour during the Graph Drawing Symposium.
-
Teams may consist of one to three participants each.
Each team may bring their own computers and/or software tools to the challenge.
-
Software tools for manually solving the challenge
will be provided for each team with time available prior to the
challenge to set-up and practice with the system.
-
At the start of the challenge, contestants will receive a
collection of five to ten graphs.
The graphs will be planar with twenty to a few thousand nodes.
-
The graphs will have an initial, planar, orthogonal layout.
In order to produce the result, the embedding is allowed to be changed.
-
For each graph, the team submitting the drawing
with the smallest longest edge receives the highest score. Scores for
other submissions of the same graph shall be weighed with respect to
this value.
The team with the highest total score over all graphs wins.
Remote Participation
For those teams that cannot attend the conference but still wish to
compete (in the automatic category), we allow remote participation.
A few key points:
-
Participants should contact the committee prior to the contest, and
preferably as early as possible, to help determine the number
of remote teams and to coordinate the instructions.
-
At the time of the challenge, remote teams will be able to access
an online location (website) to download the data sets and then
simply submit the results via email.
-
Detailed submission instructions will be provided on this site
at a later time.
File Format
For the GD2010 contest,
an ASCII format described below will be used.
The contest graphs will be provided in this format and
the final submissions should be prepared using the same format.
-
The first number (N) indicates the number of nodes in the graph.
-
The next 2N numbers contain the coordinates of the nodes.
Each coordinate consists of the x and the y value of the node,
indicating its position.
-
The remainder of the file contains the edges.
For each edge, the first value is the index of the source node, and
the second value is the index of the target node.
Next follows an array with an even number of values, enclosed by
[ ... ], which are the x and y coordinates
of the bend points of the edge.
-
An edge that has no bend points is written as an empty
bend array
[].
-
The nodes are labeled from 0 to N-1 and
the order from the input file must be used in the output file as well.
-
Comments are allowed as indicated below.
-
The edge order is not important.
-
The contest graphs will have random start locations for the nodes.
-
All numbers are integers.
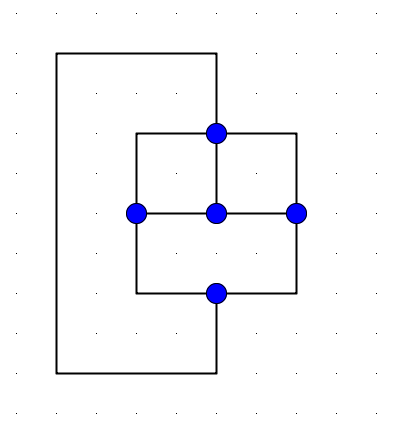
Sample File
Below is a simple example:
# Lines starting with # are comments and ignored
# First value is NumNodes(N)
5
#
# Next N pairs are x and y coordinate values of each node
4 2  # Node 0
2 4  # Node 1
4 4  # Node 2
6 4  # Node 3
4 6  # Node 4
#
# Remaining lines are the edges.
# The first value is the source node.
# The second value is the target node.
# The values between [ ... ] are grouped in pairs as bend points (X,Y)
1 0 [ 2 2 ]             # Edge between Node 1 and Node 0 with bend point (2,2)
0 3 [ 6 2 ]             # Edge between Node 0 and Node 3 with bend point (6,2)
2 1 []                  # Edge between Node 2 and Node 1 with no bend points
2 3 []                  # Edge between Node 2 and Node 3 with no bend points
0 2 []                  # Edge between Node 0 and Node 2 with no bend points
1 4 [ 2 6 ]             # Edge between Node 1 and Node 4 with bend point (2,6)
4 3 [ 6 6 ]             # Edge between Node 4 and Node 3 with bend point (6,6)
0 4 [ 4 0 0 0 0 8 4 8 ] # Edge with bend points (4,0), (0,0), (0,8) and (4,8)
|
The diagram below corresponds to this input file.
This layout is not optimal, since it can be compressed so that the longest
edge gets shorter.
The longest edge is the one between node 0 and node 4.
It has the length 20, since it has two segments of length 2, two segments of length 4 and one segment of length 8.
Legal notice
|